Solana (SOL) Surges Past $130 Resistance As Funding Rate Signals Bullish Momentum
10 Septiembre 2024 - 1:00PM
NEWSBTC
The crypto market experienced a notable surge yesterday, with
Solana (SOL) breaking past the crucial 4-hour resistance at $130.
This breakout has caught the attention of investors, who now
anticipate a potential price surge in the coming months as market
sentiment remains optimistic. Related Reading: Solana (SOL) 180-Day
Consolidation Set to Break: Massive Rally Just Around the Corner?
Many analysts are forecasting further gains, pointing to Solana’s
recent performance as a key indicator of its strength. Investors
are particularly focused on SOL’s ability to maintain its momentum,
with growing demand and increased interest fueling bullish
predictions for the altcoin. In addition to market enthusiasm,
Coinglass’s on-chain metrics reveal a positive outlook for Solana.
These metrics reinforce the bullish momentum, suggesting a
potential Solana rally. As more investors look to capitalize on
these trends, Solana’s performance could soon play a crucial role
in determining the overall market direction for altcoins. Solana
On-Chain Metrics Suggest Strength Solana is currently
testing local supply and attempting to break past a crucial daily
resistance level at $137l, as on-chain metrics from Coinglass
reveal a strong bullish sentiment among traders and
investors. One key metric highlighting this bullish sentiment
is Solana’s Open Interest (OI)-Weighted Funding Rate, which
currently stands at +0.0068%. When the funding rate is positive,
traders holding long positions pay funding fees to those with short
positions, which typically indicates expectations for rising
prices. This suggests bullish momentum is building, with traders
anticipating a short-term rally in Solana’s price. The growing
interest from long positions further supports the thesis that
Solana may be gearing up for a price surge. Bulls dominate the
asset, and the data indicates a strong possibility that SOL could
break out of its current trading range if the market conditions
remain favorable. However, for this bullish outlook to hold, Solana
must break through its current resistance level at $138 and close a
daily candle above this key point. If the price breaks and holds
above $138, it could signal a potential move toward higher price
targets in the coming weeks. Related Reading: Avalanche (AVAX)
Ready To Target $28: Investors Expect A Reversal As the market
evolves, traders will closely watch Solana’s price action and
market structure to gauge whether a significant rally is imminent.
In the meantime, Solana continues to show promise, with bullish
indicators supporting a positive short-term outlook for the asset.
SOL Price Action Solana (SOL) is currently trading at $135, just
4.5% away from a crucial technical indicator: the 4-hour 200
exponential moving average (EMA), which sits at $141.14. This level
is a key marker of strength for SOL, and reclaiming it would signal
that the bulls are gaining momentum. If SOL successfully breaks
through the $135 resistance level and reclaims the 4-hour 200 EMA,
it could trigger a significant upward move toward the $160 supply
zone. This would mark a major recovery for the asset, potentially
attracting more buyers and pushing the price higher. Related
Reading: Cardano (ADA) Rally Brewing? On-Chain Metrics Suggest
Investors Optimism However, if Solana fails to break past the $135
resistance, a retracement to lower demand levels is likely. $126 is
the buyers’ next potential support level to step in and prevent a
price drop. As SOL continues to test these key levels, traders are
watching closely to see whether the bulls can maintain control or
if a correction is on the horizon. Featured image from Dall-E,
chart from TradingView
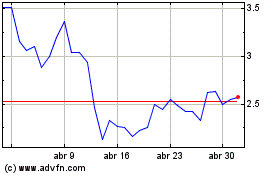
Optimism (COIN:OPUSD)
Gráfica de Acción Histórica
De Dic 2024 a Ene 2025

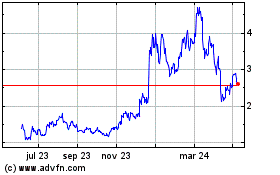
Optimism (COIN:OPUSD)
Gráfica de Acción Histórica
De Ene 2024 a Ene 2025
