This Indicator Hints US Investors Sold Bitcoin Harder Than Others During Crash
15 Noviembre 2022 - 1:00PM
NEWSBTC
The Bitcoin Coinbase Premium Index suggests US investors have been
selling more heavily than others during the latest crash in the
crypto. Bitcoin Coinbase Premium Index Has Turned Deep Red Recently
As pointed out by an analyst in a CryptoQuant post, whales on
Coinbase Pro seem to have been behind the latest dump. The
“Coinbase Premium Index” is an indicator that measures the
percentage difference between the Bitcoin price listed on Coinbase
Pro (USD Pair) and the one listed on Binance (USDT pair). Coinbase
Pro is popularly known to be used by investors based in the US
(especially large institutionals), while Binance gets a more global
traffic. Therefore, the price gaps listed on these two crypto
exchanges can hint at which investors are selling or buying more.
When the metric has a positive value, it means the value of BTC on
Coinbase is higher than on Binance right now, suggesting that US
investors have provided more buying pressure recently. Related
Reading: Bitcoin Moves Differently From US Stock Market,
Correlation Weakening? On the other hand, negative values of the
premium suggest American holders are dumping more than global
investors at the moment. Now, here is a chart that shows the trend
in the Bitcoin Coinbase Premium Index over the past year: The value
of the metric seems to have been red in recent days | Source:
CryptoQuant As you can see in the above graph, the Bitcoin Coinbase
Premium Index has plunged into negative values recently along with
the crash. This means that US investors have been dumping more
aggressively than investors from the rest of the world in the past
week. Related Reading: Quant Points Out Striking Resemblance
Between 2017 And 2021 Bitcoin Cycles Also, as is clearly visible in
the chart, a similar trend was also seen back in early May, when
BTC’s price crashed from $40k to $30k. The quant notes that while
Coinbase observed this selling, the Bitcoin Korea Premium Index
showed an interesting behavior. The below chart highlights this
trend. Looks like this metric had a green value recently | Source:
CryptoQuant The Korea Premium Index measures the gap between the
prices listed on South Korean crypto exchanges, and that on other
exchanges. From the graph, it’s apparent that during both the
current crash as well as the one in May, the indicator showed
positive spikes. This implies that while the US investors were
dumping, the Korean investors were focusing on “buying the dip.”
BTC Price At the time of writing, Bitcoin’s price floats around
$16.8k, down 15% in the last week. Over the past month, the crypto
has shed 11% in value. BTC has been stuck in consolidation under
$17k in the last few days | Source: BTCUSD on TradingView Featured
image from Unsplash.com, charts from TradingView.com,
CryptoQuant.com
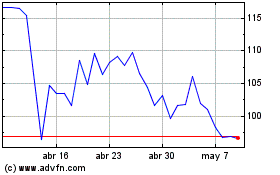
Quant (COIN:QNTUSD)
Gráfica de Acción Histórica
De Mar 2024 a Abr 2024

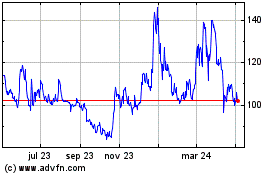
Quant (COIN:QNTUSD)
Gráfica de Acción Histórica
De Abr 2023 a Abr 2024
