XEC Token Spikes Over 17% In The Last Week, Can It Sustain Rally?
19 Septiembre 2023 - 9:00AM
NEWSBTC
XEC has continued its uptrend today, September 19, following a
sharp spike from $0.000022 to a high of $0.000028 on September 18.
This price move represents a nearly 23% increase. Although there’s
been a slight pullback, its price remains around $0.000027. In the
early hours of today, XEC traded at $0.000027, with a 15% 24-hour
price increase. But as of the time of writing, XEC traded at
$0.000026, with a 4% decline in the last 24 hours. Nonetheless, its
trading volume remains up by 311% in the last 24 hours, depicting
increased network activity. Related Reading: Shiba Inu
Gearing Up For A 60% Surge? Key Indicators To Watch Interestingly,
the ongoing uptrend has persisted over the past seven days with an
over 17% increase in its price. The bullish momentum has allowed
XEC to retain most of its past month’s gain, with an 8% 30-day
price increase. But what’s driving it, and how long can it last?
What Is Driving XEC’s Rally And How Long Will The Rally Last? The
eCash ecosystem has witnessed exciting developments that sparked
massive investor interest in the past few weeks. These developments
might be the driving force behind XEC’s impressive
performance. One such innovation is the eCash Mainnet
integration with RocketX, a crypto-swapping platform. This
integration helps users easily swap several cryptocurrencies,
including BTC, ETH, and Cosmos, with the XEC token, thus increasing
network activity. Furthermore, on September 13, eCash
developers announced that PayButton, an online vendor payment
portal, now supports XEC. The upgraded PayButton, initially
launched in February 2019, will make it easier for online vendors
to monitor their payments. According to the developers, the
goal is to increase eCash usage online. Also, they aim to achieve
increased adoption by making eCash user-friendly. The upgrade
has likely spiked the interest of investors, given the rise in the
global relevance of e-commerce. According to Santiment data, eCash
witnessed a 270% uptick in social volume in the last three days.
Also, network development has increased by 120% over the past seven
days. While these developments boosted XEC’s price these past few
days, the ongoing rally’s longevity remains uncertain, given the
market’s unpredictable nature. However, the following analysis
could provide hints. Buyers Show Dominance On The Daily Chart: Will
Their Charge Sustain XEC’s Rally? A close examination of the daily
chart suggests the bulls are determined to facilitate more gains
for XEC. Their strong market dominance is evident in the formation
of the large green candle on the daily chart. While the token’s
price remains below the 200-day Simple Moving Average, the upper
wick of today’s candle has a charge above this price level
($0.0000277). This suggests that the bulls intend to sustain the
rally for longer. Nonetheless, XEC is bullish on the short term as
the buyers have sustained its price above the 50-day SMA. This
observation also confirms an ongoing accumulation of the tokens,
leading to the prevailing price surge. Given these technical
indicators, the uptrend will continue if XEC closes above the
200-day SMA in the coming days. Moreover, the Relative Strength
Index (RSI) at 64.2, approaching the overbought area, confirms
buyers’ dominance. Related Reading: Ripple CTO Explains Company’s
Stance On Debunking Outrageous XRP Price Predictions Additionally,
this setup depicts an accumulation phase as more traders open new
long positions ahead of further price gains. The ongoing rally will
likely persist until XEC attains an overbought condition when
buyers reach saturation. However, a retracement after it enters the
overbought zone is still possible. Featured image from Pixabay and
chart from TradingView.com
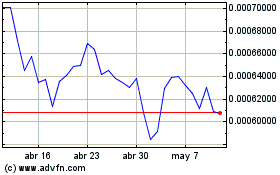
eCash (COIN:XECUSD)
Gráfica de Acción Histórica
De Mar 2024 a Abr 2024

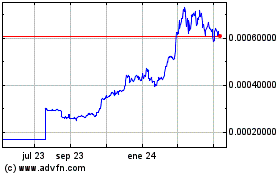
eCash (COIN:XECUSD)
Gráfica de Acción Histórica
De Abr 2023 a Abr 2024
