Analyst Identifies Bullish Pattern That Can Send XRP Price To New Highs
30 Julio 2024 - 10:00AM
NEWSBTC
Crypto analyst Mikybull Crypto has identified a bullish pattern
that can send the XRP price to new highs. This comes amid the
growing increase in the investors’ bullish sentiment towards the
XRP token. Bull Pennant Pattern Forms On XRP’s Chart Mikybull
Crypto stated in an X (formerly Twitter) post that XRP has formed a
bull pennant continuation pattern on the daily chart. The analyst
added that the “breakout will be massive,” with XRP set to rise
above $1 based on the chart he shared. Mikybull Crypto seemed
really confident that XRP would rise to such heights, as he claimed
that this bullish pattern “rarely fails.” Related Reading: Donald
Trump Reveals Plans For US Government’s 213,239 Bitcoin If Elected
A bull pennant is a technical indicator that signals the
continuation of an uptrend after a period of consolidation.
Mikybull Crypto had previously mentioned that XRP was going to have
a cool-off period after hitting the first short-term target of
$0.58. Indeed, XRP is currently experiencing a consolidation
period, having hovered around the $0.60 range for the past few
weeks. However, the formation of the bull pennant pattern
suggests that XRP is well-primed to continue its bull rally and
move to $1. A rise to $1 will be significant for XRP, considering
that it will be the first time that the crypto token has hit this
price market since 2021. XRP failed to hit this price mark even
when Judge Analisa Torres declared that the crypto token wasn’t a
security last year. Meanwhile, Mikybull Crypto has suggested
that XRP’s rise to $1 is just the beginning of the massive heights
the crypto token will reach in this bull run. The analyst stated
that XRP would surprise many doubters in this market cycle while
also predicting that the coin could replicate its 2017 and rise to
as high as $4 if a similar price movement eventually occurs.
Confirmation Of XRP Price Replicating 2017 Rally Mikybull Crypto
also recently affirmed his prediction that XRP would replicate its
2017 rally when the token enjoyed a price gain of over 61,000% in
280 days. In an X post, he stated that XRP is displaying
“significant technical signs” that occurred in 2017 and led to
these massive gains afterward. He added that historically, the
chart always precedes the news, meaning that XRP is well set up for
that catalyst that could spark such a run. Related Reading:
Crypto Analyst Charts Bitcoin Course To New $77,604 All-Time High A
conclusion to the long-running legal battle between the US
Securities and Exchange Commission (SEC) and Ripple is believed to
be one factor that could spark such a parabolic rally for XRP. The
case is expected to end soon enough, with the only thing remaining
is a ruling from Judge Torres on the appropriate remedies to be
awarded against Ripple. At the time of writing, the XRP price
is trading at around $0.59, down almost 2% in the last 24 hours,
according to data from CoinMarketCap. Featured image created
with Dall.E, chart from Tradingview.com
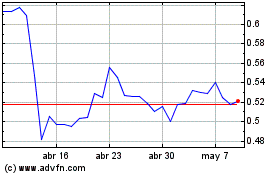
Ripple (COIN:XRPUSD)
Gráfica de Acción Histórica
De Jun 2024 a Jul 2024

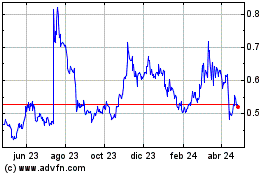
Ripple (COIN:XRPUSD)
Gráfica de Acción Histórica
De Jul 2023 a Jul 2024
