Solana Surges As Momentum Resumes, Is $240 the Next Stop?
14 Noviembre 2024 - 3:00PM
NEWSBTC
Solana (SOL) is gaining momentum once more, with bullish energy
pushing it higher as it aims for the next major resistance at $240.
Following recent consolidations, SOL has surged onto traders’
radars with renewed buying interest, sparking optimism that the
climb will continue. With market sentiment turning increasingly
favorable and technical indicators pointing toward further gains,
all eyes are on SOL’s potential to break through its next
significant threshold. Could this be the start of a rally that
propels Solana to new heights? As bullish momentum builds, this
article delves into Solana’s recent price action to evaluate
whether its current upward trajectory has the strength to drive it
toward the $240 mark. We’ll assess SOL’s capacity to sustain its
rally and reach this pivotal price target by analyzing key
technical indicators, market dynamics, and support and resistance
levels. Exploring The Factors Behind SOL’s Uptrend Solana is
currently trading above the 100-day Simple Moving Average (SMA) on
the 4-hour chart, a clear indication of upside strength. After
experiencing a brief pullback to the $200 level, SOL has regained
strength, with renewed buying interest pushing it toward the next
key resistance at $240. This upward movement suggests that the
bulls are in control, and if SOL can maintain its momentum, it
could soon challenge and possibly break through the $240 level,
opening the door to further gains. An analysis of the 4-hour
Relative Strength Index (RSI) reveals that the RSI has risen above
the 50% threshold after dipping below it, signaling a shift in
market sentiment. If the RSI continues to rise and stays above 50%,
it points to the potential for more price growth and continued
confidence in the price’s ability to gain. Related Reading: Solana
Breaks Above Key Resistance – Top Analyst Sets $300 Target
Additionally, the daily chart reveals that Solana is experiencing
strong upside movement, reflected in the formation of bullish
candlestick patterns. With the asset trading above the key 100-day
SMA, its positive trend is further validated. As SOL maintains this
trajectory, it bolsters market confidence, setting the stage for
more gains as it eyes the $240 target. Lastly, the RSI on the daily
chart is at 71%, showing strong optimistic sentiment after
recovering from a dip to 69%. This rebound indicates a resurgence
in buying pressure, suggesting a shift toward a more positive
market outlook. The RSI’s constant increase signals that the asset
may maintain its upward trajectory, supporting the ongoing bullish
trend and paving the way for additional gains. Can Solana Break
Through Resistance On Its Path To $240? Solana is currently
demonstrating strong bullish momentum, holding above the crucial
100-day SMA and recovering from recent pullbacks. As SOL advances
toward the $240 target, a breakout above this level could trigger
an extended buying pressure, propelling the price toward its
all-time high of $260. Related Reading: Solana Market Cap Surpasses
$100 Billion, Setting Up SOL For Potential ATH Rally However,
failure to break above the $240 resistance could cause a decline,
with the price targeting the $209 level and other support ranges
further down. Featured image from Adobe Stock, chart from
Tradingview.com
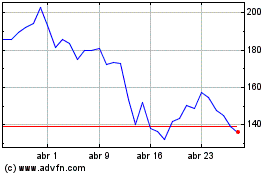
Solana (COIN:SOLUSD)
Gráfica de Acción Histórica
De Dic 2024 a Ene 2025

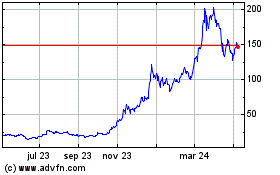
Solana (COIN:SOLUSD)
Gráfica de Acción Histórica
De Ene 2024 a Ene 2025
