SUI Bearish Move Gathers Pace After A Breach Below Key Moving Average
13 Enero 2025 - 6:30AM
NEWSBTC
SUI bearish narrative has gained traction as the price slips
below the 4-hour Simple Moving Average (SMA), a critical threshold
for gauging market direction. The break below this level
underscores mounting selling pressure and raises concerns about the
asset’s ability to recover in the short term. The 4-hour SMA,
previously acting as a support level, now poses a significant
barrier to any potential bullish rebound, reflecting a clear shift
in momentum favoring the bears. With this development, the
likelihood of a continued breakdown tends to increase, possibly
pushing SUI toward lower support levels. Traders and
investors are closely watching the asset’s ability to stabilize and
reclaim lost ground, as failing to do so could open the door for
deeper corrections. Nonetheless, a recovery above the 4-hour SMA
would be pivotal in reversing the current trend toward an upward
trajectory, signaling renewed strength. Analyzing SUI’s Price
Action: Signs Of A Deepening Breakdown Current price action reveals
that SUI is under significant bearish influence, with the $3.9
support level emerging as a critical juncture. SUI’s breach below
the 4-hour SMA has heightened concerns about extended declines as
the price struggles to regain upside momentum. Related Reading: SUI
Defies Odds With A Sharp Rebound Above $4.9: New Highs Loom? The
$3.9 level is presently serving as a potential buffer against
steeper losses. A decisive break below this threshold might cause a
sustained bearish trend to lower targets. Such a move may also
signal growing negative sentiment, leading to increased selling
pressure in the market. However, if the $3.9 support holds firm, it
could provide a foundation for a rebound. This scenario would hinge
on increased buying activity and improved market sentiment, which
is likely to push SUI back toward higher resistance levels.
Furthermore, the current movement of the Composite Trend Oscillator
adds weight to the argument that SUI’s bearish trend could continue
toward the $3.9 level. This trend line and the RSI are moving
closer to the oversold territory, suggesting increasing downward
pressure and the possibility of further declines. Can SUI Avoid
Further Declines? SUI is facing heightened market pressure as
bearish momentum takes hold with its ability to maintain key
support levels now under scrutiny. A breach below the 4-hour SMA
has added to the negative sentiment, signaling a potential downward
trend. Also, breaking below the $3.9 key support might trigger more
drops, bringing the next support zone at $2.8 into focus. Related
Reading: SUI Skyrockets: Bullish Momentum Drives Push Toward $6
Meanwhile, if the price maintains its position above $3.9, it could
pave the way for a possible rebound, allowing SUI to break through
the 4-hour SMA and target the $4.9 resistance level and beyond.
Thus far, the coming sessions will be crucial in determining
whether SUI can stabilize or succumb to a deeper breakdown.
Featured image from YouTube, chart from Tradingview.com
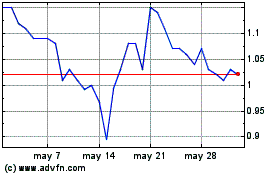
SUI Network (COIN:SUIUSD)
Gráfica de Acción Histórica
De Dic 2024 a Ene 2025

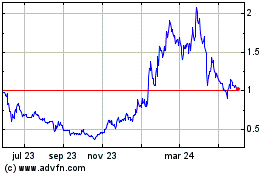
SUI Network (COIN:SUIUSD)
Gráfica de Acción Histórica
De Ene 2024 a Ene 2025
