Solana Plummets 17% As SOL Hits $118: Is a Break Below Inevitable?
05 Agosto 2024 - 7:00AM
NEWSBTC
Solana (SOL) is currently experiencing a significant decline,
dropping over 17% and reaching the critical $118 support level.
This sharp downturn has put considerable pressure on this key
level, raising concerns among traders and investors about the
possibility of a further breakdown. The $118 level has historically
been a stronghold for the cryptocurrency, but with the current
bearish sentiment in the market, its ability to hold is still being
determined. With the help of key technical indicators, this
article will provide an in-depth analysis of Solana’s current price
actions, assess the likelihood of breaking the $118 support, and
explore potential scenarios for SOL. As of the time of writing,
Solana has dropped by 17%, trading at approximately $119.78 in the
past 24 hours. Solana boasts a market capitalization exceeding $54
billion, which demonstrates a decrease of 18.45% and a trading
volume surpassing $9.4 billion, indicating an increase of 182.21%
in the past 24 hours. Technical Analysis: Indicators Pointing To A
Potential Break For Solana On the 4-hour chart, Solana has
demonstrated significant bearish momentum, with the price dropping
below the 100-day Simple Moving Average (SMA) and currently
attempting a break below the $118 support level. A successful
breach below this key level could lead to a further bearish move
for the cryptocurrency. The Relative Strength Index (RSI) on the
4-hour chart has dropped to 24.74%, which is considered to be an
oversold zone. This position of the RSI indicator signals that SOL
could extend its bearish move beyond $118. On the 1-day chart,
Solana has experienced increased selling pressure as the price
consistently forms bearish candlesticks. Specifically, this pattern
shows sellers are gaining control over the market, pushing the
price lower with each successive trading session. Also, the
formation of these bearish candlesticks, characterized by closing
prices lower than their opening prices, reflects a pattern of
sustained selling, which is often a sign of underlying weakness in
the asset. Finally, the 1-day RSI has also dropped below 50%, which
further supports the possibility of further price drop. This drop
suggests that bearish pressure is rising, as sellers are still
active and influential in the market. The fact that sellers are
still active implies that Solana will probably continue to decline.
Potential Scenarios: What Happens if $118 Fails? If Solana can
maintain its current bearish momentum and close below the $118
support level, it may continue to move downward to challenge the
$99.44 support level. When this level is breached, the digital
asset may experience further price loss toward the $79.24 support
range and possibly other ranges below. Conversely, should SOL’s
price close above the $118 support level, it will start to ascend
once more toward the $160 resistance point. Following a break above
this level, the crypto asset may see further price gain to
challenge the $170 resistance level and perhaps other levels above.
Featured image from Adobe Stock, chart from Tradingview.com
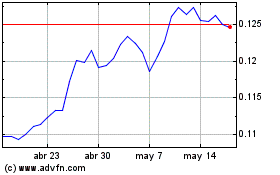
TRON (COIN:TRXUSD)
Gráfica de Acción Histórica
De Oct 2024 a Nov 2024

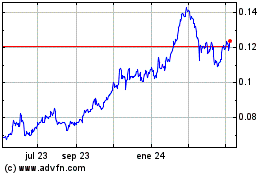
TRON (COIN:TRXUSD)
Gráfica de Acción Histórica
De Nov 2023 a Nov 2024
