Barrett Attains 52-Week High - Analyst Blog
13 Diciembre 2012 - 7:45AM
Zacks
Shares of Barrett Business
Services Inc. (BBSI) reached a new 52-week high of $36.87
on Wednesday, Dec 12, 2012, beating its previous 52-week high of
$36.05. The closing price of this provider of business management
solutions as on Dec 12, 2012, was $36.32, which represented a solid
year-to-date return of 100.1%. Average volume of shares traded over
the last 3 months stands at approximately 42,653.
Growth Drivers
An impressive record of beating the
quarterly earnings expectations, a positive fiscal 2012 outlook,
and a decent dividend yield, are the major growth drivers for the
shares of Barrett Business Services.
With respect to earnings surprise,
Barrett Business Services has been beating the quarterly earnings
expectations for the last three years, most recently topping by
14.1% in its fiscal 2012 third quarter.
On Oct 23, 2012, Barrett Business
Services reported third-quarter earnings per share of 81 cents,
ahead of the Zacks Consensus Estimate of 71 cents. Moreover, it
surged 50% from the year-ago quarter.
Revenues grew 30% year over year to
$111.1 million, driven by strong growth in the Professional
Employer Organization (PEO) client count and strong same-store
sales growth. The company’s professional employer services and
staffing services business segments reported revenue growth of
40.5% and 4.6%, respectively.
Management acknowledged the solid
client base and asserted that client retention was strong. The
company attributed the solid results in the quarter to BBSI's
maturing brand and strong referral channels, which helped drive new
clients along with its ability to retain them.
In the fourth quarter, the company
projects gross revenues of between $585 million and $590 million,
with earnings per share in the range of 75 – 78 cents.
Barrett Business Services rewards
its shareholders through regular quarterly dividends and increasing
the same. In November, the company announced its fourth-quarter
2012 dividend of 13 cents per share, payable on Dec 14, 2012 to the
shareholders of record as on Nov 30, 2012 reflecting an increase of
nearly 18% from the dividend paid in the third quarter of 2012.
This yields a solid 1.43%, while the company has a payout ratio of
39%. We believe that the company’s continuous dividend payment and
increments reflects its earnings growth capacity and cash flow
generation.
Valuation is
Attractive
Currently, Barrett Business
Services trades at a forward P/E of 23.28x, slightly above the peer
group average of 21.77x. Again, its price-to-book and
price-to-sales ratios of 5.23 and 0.68 are at a premium to the peer
group average of 2.55 and 0.62, respectively.
However, the company’s trailing
12-month ROE of 20.0%, against 6.8% for the peer group, suggests
that it actively and efficiently reinvests its earnings compared to
the peer group. In addition, these compelling fundamentals are well
supported by the company’s long-term estimated earnings growth rate
of 35.0% compared with 17.8% of the peer group.
The company’s shares have been
advancing since the beginning of calendar year 2012, gaining a
robust 100.1% year-to-date.
About The
Company
Barrett Business Services has
roughly 47 years of experience in providing business management
solutions. The company offers staffing and professional employer
organization services, which help employers to manage
employment-related issues efficiently while reducing operational
costs to a great extent. The host of service offerings includes
payroll processing, employee benefits and administration, workers’
compensation coverage, effective risk management and workplace
safety programs, and human resource administration. The company has
a market cap of approximately $255 million.
Barrett Business Services, which
competes with Insperity, Inc. (NSP), currently,
holds Zacks #1Rank, implying a short-term Strong Buy rating. We are
also maintaining a long-term ‘Outperform’ recommendation on the
stock.
BARRETT BUS SVS (BBSI): Free Stock Analysis Report
INSPERITY INC (NSP): Free Stock Analysis Report
To read this article on Zacks.com click here.
Zacks Investment Research
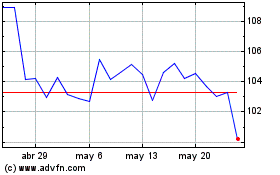
Insperity (NYSE:NSP)
Gráfica de Acción Histórica
De Ago 2024 a Sep 2024

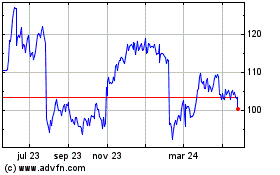
Insperity (NYSE:NSP)
Gráfica de Acción Histórica
De Sep 2023 a Sep 2024
