Endeavour Silver Corp. (TSX:EDR)(NYSE:EXK) achieved its ninth consecutive year
of production growth in 2013, reporting record production of 6,813,068 ounces
(oz) silver and 75,578 oz gold. The Company also set a new record for quarterly
silver and gold production in the Fourth Quarter, 2013 from the Company's three
operating silver mines in Mexico: the Guanacevi Mine in Durango State and the
Bolanitos and El Cubo Mines in Guanajuato State.


Silver production in the Fourth Quarter, 2013 was up 56% to 1,931,717 oz and
gold production was up 37% to 17,686 oz compared to the Fourth Quarter, 2012.
Revenue was up 2% to approximately US$67.9 million as a result of the increased
precious metals production, offset by lower metal prices.


Silver production in 2013 was up 52% to 6,813,069 oz and gold production was up
95% to 75,578 oz compared to 2012. Revenue was up 33% to approximately US$276.8
million in 2013 as a result of the increased precious metals production, again
offset by lower metal prices.


Production Highlights for Fiscal 2013 (Compared to Fiscal 2012)


--  Silver production increased 52% to 6,813,069 oz
--  Gold production jumped 95% to 75,578 oz
--  Silver equivalent production escalated 67% to 11.3 million oz (at a 60:1
    silver: gold ratio)
--  Revenue rose 33% to an estimated $276.8 million on 7,151,963 silver oz
    and 81,119 gold oz sold
--  Realized silver price fell 25% to $23.10 per oz sold
--  Realized gold price fell 18% to $1,375 per oz sold
--  Bullion inventory at year-end included 51,000 oz silver and 198 oz gold
--  Concentrate inventory available for sale at year-end was nil


Production Highlights for Fourth Quarter, 2013 (Compared to Fourth Quarter, 2012)


--  Silver production increased 56% to 1,931,717 oz
--  Gold production jumped 37% to 17,686 oz
--  Silver equivalent production escalated 49% to 3.0 million oz (at a 60:1
    silver: gold ratio)
--  Revenue rose 2% to an estimated $67.9 million on 2,155,326 silver oz and
    18,960 gold oz sold
--  Realized silver price fell 38% to $20.52 per oz sold
--  Realized gold price fell 28% to $1,246 per oz sold
--  Plant throughputs, ore grades and metal recoveries were higher at all
    three mines
--  Bullion and concentrate inventories were sold to avoid the new mining
    taxes effective at year-end


Bradford Cooke, CEO and Director, commented, "Endeavour's mining operations
delivered another exceptional year in 2013, significantly outperforming our
production guidance which we revised upwards in September. Each of the three
mines contributed above their mine plans for the year, with higher plant
throughputs, ore grades and metal recoveries across the board. The Bolanitos
mine in particular deserves special mention for delivering more than one million
oz silver above plan in 2013."


"Last year was a challenging one for the mining industry given the sharp
sell-off in precious metals prices, and especially so for Endeavour as we
launched a major mine and plant reconstruction program at El Cubo, which we
completed on time and under budget. We needed to enhance our cash flow to cover
our planned expenditures and we were successful notwithstanding the lower metals
prices."


"Management continues to focus on improving cash-flows by reducing costs and
increasing productivity where possible to offset the still declining precious
metals prices, especially at El Cubo. I would like to thank all of our managers,
employees and contractors for their valuable contributions in helping the
Company navigate these difficult times."


Q4 2013 Highlights

Three Months Ended Dec. 31                           Year Ended Dec. 31
                         %                                                 %
     2013      2012 Change       Production            2013      2012 Change
----------------------------------------------------------------------------
----------------------------------------------------------------------------
                               Silver ounces
1,931,717 1,235,026    56%       produced         6,813,069 4,485,476    52%
   17,686    12,917    37% Gold ounces produced      75,578    38,687    95%
                              Payable silver
1,855,108 1,222,705    52%    ounces produced     6,593,805 4,440,619    48%
                            Payable gold ounces
   16,612    12,800    30%       produced            72,562    38,311    89%
                             Silver equivalent
2,992,877 2,010,046    49%  ounces produced(1)   11,347,749 6,806,696    67%
----------------------------------------------------------------------------
----------------------------------------------------------------------------


----------------------------------------------------------------------------
----------------------------------------------------------------------------
                                Revenue ($
     67.9      66.7     2%     millions)(2)           276.8     208.1    33%
2,155,326 1,345,832    60%  Silver ounces sold    7,151,963 4,815,073    49%
   18,960    13,037    45%   Gold ounces sold        81,119    35,167   131%
                              Realized silver
    20.52     32.87   -38%    price per ounce         23.10     30.99   -25%
                            Realized gold price
    1,246     1,725   -28%       per ounce            1,375     1,674   -18%
----------------------------------------------------------------------------
----------------------------------------------------------------------------

(1) Silver equivalent ounces calculated using 60:1 ratio
(2) Revenue from the sale of concentrates is subject to adjustments upon
    final settlement. Concentrate sales are subject to mark-to-market
    accounting treatments resulting in quarterly closing prices used for a
    significant portion of metal sales. Reported revenue and realized prices
    include adjustments to prior quarter sales on final settlement.


Fourth Quarter Production Data
----------------------------------------------------------------------------
----------------------------------------------------------------------------
                     Tonnes  Grade  Grade
Production    Tonnes    per     Ag     Au Recovery Recovery    Silver   Gold
by mine     Produced    day gpt(1) gpt(1)     Ag %     Au %        Oz     Oz
----------------------------------------------------------------------------
Guanacevi    121,008  1,315    272   0.69    81.5%    85.2%   861,495  2,275
Bolanitos(2) 159,294  1,731    152   2.61    89.7%    75.9%   698,098 10,142
El Cubo       99,178  1,078    118   1.77    98.9%    93.4%   372,124  5,269
----------------------------------------------------------------------------
----------------------------------------------------------------------------
Consolidated 379,480  4,125    181   1.78    87.3%    81.6% 1,931,717 17,686
----------------------------------------------------------------------------
----------------------------------------------------------------------------

(1) gpt = grams per tonnes
(2) Includes 16,813 tonnes (183 tpd) processed at El Cubo

2013 Production Data
----------------------------------------------------------------------------
----------------------------------------------------------------------------
                              Grade Grade
                       Tonnes    Ag    Au
Production      Tonnes    per   gpt   gpt Recovery Recovery    Silver   Gold
by mine       Produced    day   (1)   (1)     Ag %     Au %        Oz     Oz
----------------------------------------------------------------------------
----------------------------------------------------------------------------
Guanacevi      435,922  1,194   253  0.60    78.2%    80.7% 2,772,227  6,784
Bolanitos(3)   710,708  1,947   149  2.63    84.6%    86.0% 2,881,816 51,652
El Cubo        391,354  1,072   107  1.57    86.1%    86.8% 1,159,026 17,142
----------------------------------------------------------------------------
----------------------------------------------------------------------------
Consolidated 1,537,984  4,214   168  1.78    82.1%    85.6% 6,813,069 75,578
----------------------------------------------------------------------------
----------------------------------------------------------------------------

(1) gpt = grams per tonnes
(3) Includes 150,526 tonnes (412 tpd) processed at El Cubo


At Guanacevi, the plant operated well above plan in the Fourth Quarter, 2013,
processing over 1,300 tonnes per day (tpd) at higher than planned grades and
recoveries. As a result, Guanacevi achieved record silver production in the
Fourth Quarter, 2013 and reported its highest ever annual production.
Throughput, grades and recoveries are expected to pull back closer to plan over
the long term.


At Bolanitos, mine output was reduced in November, 2013 to the 1,600 tpd
capacity of the plant and grades and recoveries continued to exceed plan. As a
result, Bolanitos also set both quarterly and annual production records in the
Fourth Quarter, 2013. No excess mine output is planned from Bolanitos near term
to fill the El Cubo plant to capacity, as the focus is now on expanding the El
Cubo mine output.


At El Cubo, the operational changes implemented over the past year have gained
traction and now appear to be sustainable. Production grades continue to trend
higher as the operation reduces dilution and eliminates production from
uneconomic stopes. Although no new material was fed into the El Cubo leach
circuit during the Fourth Quarter, the plant continued to recover ounces from
residual material in the circuit, resulting in approx. 10% higher recoveries
than expected.


About Endeavour Silver - Endeavour is a mid-tier silver mining company focused
on growing its profits, production, reserves and resources in Mexico. Since
start-up in 2004, Endeavour has posted nine consecutive years of accretive
growth of its silver mining operations. The organic expansion programs now
underway at Endeavour's three silver-gold mines in Mexico combined with its
strategic acquisition and exploration programs should facilitate Endeavour's
goal to become a premier senior silver producer.


Cautionary Note Regarding Forward-Looking Statements

This news release contains "forward-looking statements" within the meaning of
the United States private securities litigation reform act of 1995 and
"forward-looking information" within the meaning of applicable Canadian
securities legislation. Such forward-looking statements and information herein
include but are not limited to statements regarding Endeavour's anticipated
performance in 2014 and the timing and results of exploration drill programs.
The Company does not intend to, and does not assume any obligation to update
such forward-looking statements or information, other than as required by
applicable law.


Forward-looking statements or information involve known and unknown risks,
uncertainties and other factors that may cause the actual results, level of
activity, performance or achievements of Endeavour and its operations to be
materially different from those expressed or implied by such statements. Such
factors include, among others, changes in national and local governments,
legislation, taxation, controls, regulations and political or economic
developments in Canada and Mexico; operating or technical difficulties in
mineral exploration, development and mining activities; risks and hazards of
mineral exploration, development and mining; the speculative nature of mineral
exploration and development, risks in obtaining necessary licenses and permits,
and challenges to the Company's title to properties; as well as those factors
described in the section "risk factors" contained in the Company's most recent
form 40F/Annual Information Form filed with the S.E.C. and Canadian securities
regulatory authorities.


Forward-looking statements are based on assumptions management believes to be
reasonable, including but not limited to: the continued operation of the
Company's mining operations, no material adverse change in the market price of
commodities, mining operations will operate and the mining products will be
completed in accordance with management's expectations and achieve their stated
production outcomes, and such other assumptions and factors as set out herein.
Although the Company has attempted to identify important factors that could
cause actual results to differ materially from those contained in
forward-looking statements or information, there may be other factors that cause
results to be materially different from those anticipated, described, estimated,
assessed or intended. There can be no assurance that any forward-looking
statements or information will prove to be accurate as actual results and future
events could differ materially from those anticipated in such statements or
information. Accordingly, readers should not place undue reliance on
forward-looking statements or information.


FOR FURTHER INFORMATION PLEASE CONTACT:
Endeavour Silver Corp.
Meghan Brown
Director Investor Relations
(604) 640-4804 or Toll free: (877) 685-9775
(604) 685-9744 (FAX)
mbrown@edrsilver.com
www.edrsilver.com
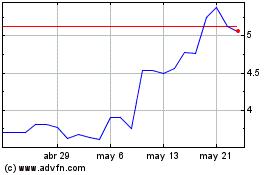
Endeavour Silver (TSX:EDR)
Gráfica de Acción Histórica
De Mar 2025 a Abr 2025

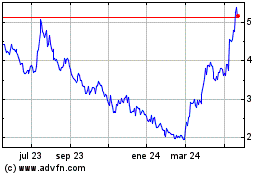
Endeavour Silver (TSX:EDR)
Gráfica de Acción Histórica
De Abr 2024 a Abr 2025
