Bitcoin ‘Hodl Wave’ Data Has Now Been Calling a Bull Run for 5 Months
27 Mayo 2020 - 3:27AM
Cointelegraph

Hodl waves show that over 60% of the supply has not moved for a
year or more, something which historically has signaled price
upside.
...
Continue reading Bitcoin ‘Hodl Wave’ Data Has Now
Been Calling a Bull Run for 5 Months
The post
Bitcoin ‘Hodl Wave’ Data Has Now Been Calling a Bull
Run for 5 Months appeared first on
CoinTelegraph.
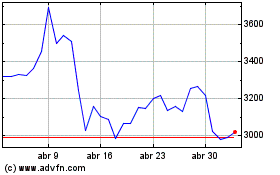
Ethereum (COIN:ETHUSD)
Gráfica de Acción Histórica
De Mar 2024 a Abr 2024

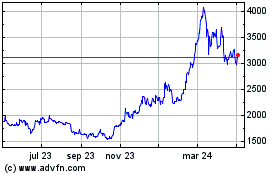
Ethereum (COIN:ETHUSD)
Gráfica de Acción Histórica
De Abr 2023 a Abr 2024
