SUI About To Break ATH Again – Can Bulls Target $4.20 This Week?
05 Diciembre 2024 - 2:30PM
NEWSBTC
SUI trades at crucial supply levels, sparking intense speculation
among traders and analysts about its next move. After recently
reaching a new all-time high (ATH), the price failed to sustain
above its previous ATH, raising concerns about whether this was a
genuine breakout or merely a fakeout. The current price action has
left market participants waiting for confirmation as bulls attempt
to reclaim dominance. Related Reading: Dogecoin Is ‘Ready To Run
Again’ – Analyst Expects 60% Rally Renowned analyst and investor
Carl Runefelt has shared a bullish outlook for SUI, predicting an
imminent breakout. According to his analysis, a successful push
above the current supply levels could trigger a rally toward $4.20
in the coming days—or potentially within hours. Runefelt’s
perspective adds confidence to the market sentiment, suggesting
that SUI still holds the potential to reclaim its upward trajectory
despite recent setbacks. The coming days are crucial for SUI as
traders monitor whether bulls can overcome the key resistance
levels. A decisive breakout could solidify SUI’s position as one of
the most promising assets in the crypto market. At the same time, a
failure to do so might result in prolonged consolidation or a
deeper pullback. All eyes remain on the $4.20 target and SUI’s
bullish momentum. SUI Only 5% Away From ATH SUI recently surged to
a new all-time high (ATH) but failed to hold above the previous ATH
of $4.05 set on November 17. Despite this brief pullback, the price
action indicates that SUI remains poised to reclaim and surpass its
ATH, with analysts and investors expecting significant upside
momentum shortly. Top analyst Carl Runefelt provided a detailed
technical analysis on X, highlighting that SUI recently broke out
of a 4-hour symmetrical triangle pattern, signaling bullish
momentum. SUI trades within a bullish flag formation, a classic
continuation pattern often preceding substantial price rallies.
Runefelt has set a price target of $4.20 in the coming hours, which
he believes could act as the next major resistance before SUI
establishes new highs. The broader market environment adds further
confidence to this bullish outlook. With strong momentum, Bitcoin’s
breakout above the $100K level has historically triggered altcoin
rallies as liquidity flows from BTC into smaller assets. This
dynamic positions SUI for a potential surge as it benefits from
heightened interest across the cryptocurrency market. Related
Reading: $1.87B Bitcoin Withdrawals From Coinbase In 24H – What
This Means To Price While the short-term outlook for SUI appears
bullish, the price must break and hold above its previous ATH to
confirm sustained upward momentum. All eyes are on $4.20 as traders
await the next move in SUI’s exciting rally. Price Discovery Rally
Or Settling Correction? SUI is trading at $3.83 after briefly
breaking its all-time high (ATH) but retracing over 6% from the
recent peak. Despite the pullback, the price remains within
striking distance of key resistance levels that could determine its
next move. If SUI breaks above $3.88 and successfully reclaims the
November 17 ATH at $3.94 as support, it will likely trigger another
breakout, setting the stage for a price discovery rally. Reclaiming
and holding these levels would signal strong bullish momentum,
potentially driving SUI into uncharted territory as buyers fuel the
next leg of its rally. Such a scenario would align with the broader
market sentiment following Bitcoin’s recent rally above $100K,
which has historically increased demand for altcoins. Related
Reading: Dogecoin Whales Keep Buying – DOGE Metrics Reveal Demand
Remains Strong However, there is a risk if SUI fails to break above
$3.88 and $3.94 in the near term. A rejection at these levels could
result in continued consolidation as the price struggles to find
direction. This would likely keep SUI trading within a range,
frustrating bulls seeking a breakout. Worse, a failure to maintain
support could lead to a deeper correction, testing lower demand
zones and cooling market enthusiasm. Featured image from Dall-E,
chart from TradingView
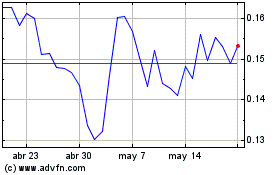
Dogecoin (COIN:DOGEUSD)
Gráfica de Acción Histórica
De Dic 2024 a Ene 2025

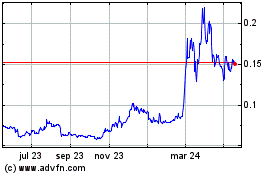
Dogecoin (COIN:DOGEUSD)
Gráfica de Acción Histórica
De Ene 2024 a Ene 2025
