Atlantic American Corporation Reports Second Quarter Results for 2024
14 Agosto 2024 - 11:11AM

Atlantic American Corporation (Nasdaq- AAME) today reported net
loss of $0.7 million, or $(0.04) per diluted share, for the three
month period ended June 30, 2024, compared to net income of $1.7
million, or $0.08 per diluted share, for the three month period
ended June 30, 2023. The Company had net loss of $2.7 million, or
$(0.14) per diluted share, for the six month period ended June 30,
2024, compared to net income of $0.3 million, or $0.00 per diluted
share, for the six month period ended June 30, 2023. The increase
in net loss for the three month and six month periods ended June
30, 2024 was primarily the result of unfavorable loss experience in
the Company’s life and health operations, as well as in the
Company’s property and casualty operations, compared to the prior
year periods.
Operating income decreased $2.8 million in the
three month period ended June 30, 2024 from the three month period
ended June 30, 2023. For the six month period ended June 30, 2024,
operating income decreased $5.7 million from the comparable period
in 2023. The decrease in operating income for the three month and
six month periods ended June 30, 2024 was primarily the result of
unfavorable loss experience in the life and health operations due
to an increase in incurred losses in the group life and Medicare
supplement lines of business. Also contributing to the decrease in
operating income was unfavorable loss experience in the property
and casualty operations due to the frequency and severity of claims
in the automobile liability line of business.
Commenting on the results, Hilton H. Howell,
Jr., Chairman, President and Chief Executive Officer, stated,
“Although this year has presented challenges in our life and health
operations, we believe our strategic investments in technology and
talent will provide the foundation for future performance. We
believe our recent product launches in several key states position
us well for a strong sales season during the upcoming annual
enrollment period. Additionally, our property and casualty division
has demonstrated remarkable resilience in a softening market,
consistently writing profitable business. We remain committed to
our long-term strategy and are optimistic about the opportunities
that lie ahead.”
Atlantic American Corporation is an insurance
holding company involved through its subsidiary companies in
specialty markets of the life, health, and property and casualty
insurance industries. Its principal insurance subsidiaries are
American Southern Insurance Company, American Safety Insurance
Company, Bankers Fidelity Life Insurance Company, Bankers Fidelity
Assurance Company and Atlantic Capital Life Assurance Company.
Note regarding non-GAAP financial measure:
Atlantic American Corporation presents its consolidated financial
statements in accordance with U.S. generally accepted accounting
principles (GAAP). However, from time to time, the Company may
present, in its public statements, press releases and filings with
the Securities and Exchange Commission, non-GAAP financial measures
such as operating income (loss). We define operating income (loss)
as net income (loss) excluding: (i) income tax expense (benefit);
(ii) realized investment (gains) losses, net; and (iii) unrealized
(gains) losses on equity securities, net. Management believes
operating income (loss) is a useful metric for investors, potential
investors, securities analysts and others because it isolates the
“core” operating results of the Company before considering certain
items that are either beyond the control of management (such as
income tax expense (benefit), which is subject to timing,
regulatory and rate changes depending on the timing of the
associated revenues and expenses) or are not expected to regularly
impact the Company’s operating results (such as any realized and
unrealized investment gains (losses), which are not a part of the
Company’s primary operations and are, to a limited extent, subject
to discretion in terms of timing of realization). The financial
data attached includes a reconciliation of operating income (loss)
to net income (loss), the most comparable GAAP financial measure.
The Company’s definition of operating income (loss) may differ from
similarly titled financial measures used by others. This non-GAAP
financial measure should be considered supplemental to, and not a
substitute for, financial information prepared in accordance with
GAAP.
Note regarding forward-looking statements:
Except for historical information contained herein, this press
release contains forward-looking statements that involve a number
of risks and uncertainties. Actual results could differ materially
from those indicated by such forward-looking statements due to a
number of factors and risks, including the Company’s ability to
remediate the identified material weakness in its internal control
over financial reporting as described in the Company’s most recent
Annual Report on Form 10-K and those other risks and uncertainties
detailed in statements and reports that the Company files from time
to time with the Securities and Exchange Commission.
|
For further information contact: |
|
|
J. Ross Franklin |
Hilton H. Howell, Jr. |
|
Chief Financial Officer |
Chairman, President & CEO |
|
Atlantic American Corporation |
Atlantic American Corporation |
|
404-266-5580 |
404-266-5505 |
| Atlantic
American Corporation |
| Financial
Data |
| |
|
|
|
| |
Three Months
Ended |
|
Six Months
Ended |
| |
June 30, |
|
June 30, |
| (Unaudited;
In thousands, except per share data) |
2024 |
|
2023 |
|
2024 |
|
2023 |
| Insurance
premiums |
|
|
|
|
|
|
|
|
Life and health |
$ |
27,449 |
|
|
$ |
28,180 |
|
|
$ |
54,123 |
|
|
$ |
57,069 |
|
|
Property and casualty |
|
17,544 |
|
|
|
17,880 |
|
|
|
35,422 |
|
|
|
35,091 |
|
|
Insurance premiums,
net |
|
44,993 |
|
|
|
46,060 |
|
|
|
89,545 |
|
|
|
92,160 |
|
| |
|
|
|
|
|
|
|
| Net
investment income |
|
2,416 |
|
|
|
2,559 |
|
|
|
4,972 |
|
|
|
5,100 |
|
| Realized
investment gains, net |
|
13 |
|
|
|
70 |
|
|
|
13 |
|
|
|
70 |
|
| Unrealized
gains (losses) on equity securities, net |
|
243 |
|
|
|
494 |
|
|
|
129 |
|
|
|
(1,881 |
) |
| Other
income |
|
3 |
|
|
|
5 |
|
|
|
6 |
|
|
|
8 |
|
| |
|
|
|
|
|
|
|
|
Total revenue |
|
47,668 |
|
|
|
49,188 |
|
|
|
94,665 |
|
|
|
95,457 |
|
| |
|
|
|
|
|
|
|
| Insurance
benefits and losses incurred |
|
|
|
|
|
|
|
|
Life and health |
|
17,579 |
|
|
|
15,817 |
|
|
|
36,691 |
|
|
|
33,617 |
|
|
Property and casualty |
|
14,228 |
|
|
|
13,548 |
|
|
|
27,041 |
|
|
|
26,208 |
|
| Commissions
and underwriting expenses |
|
11,584 |
|
|
|
12,848 |
|
|
|
24,250 |
|
|
|
25,766 |
|
| Interest
expense |
|
867 |
|
|
|
807 |
|
|
|
1,722 |
|
|
|
1,557 |
|
| Other
expense |
|
4,259 |
|
|
|
3,951 |
|
|
|
8,316 |
|
|
|
7,910 |
|
| |
|
|
|
|
|
|
|
|
Total benefits and expenses |
|
48,517 |
|
|
|
46,971 |
|
|
|
98,020 |
|
|
|
95,058 |
|
| |
|
|
|
|
|
|
|
| Income
(loss) before income taxes |
|
(849 |
) |
|
|
2,217 |
|
|
|
(3,355 |
) |
|
|
399 |
|
| Income tax
expense (benefit) |
|
(165 |
) |
|
|
473 |
|
|
|
(673 |
) |
|
|
101 |
|
| |
|
|
|
|
|
|
|
| Net
income (loss) |
$ |
(684 |
) |
|
$ |
1,744 |
|
|
$ |
(2,682 |
) |
|
$ |
298 |
|
| |
|
|
|
|
|
|
|
|
Earnings (loss) per common share (basic &
diluted) |
$ |
(0.04 |
) |
|
$ |
0.08 |
|
|
$ |
(0.14 |
) |
|
$ |
- |
|
| |
|
|
|
|
|
|
|
|
Reconciliation of non-GAAP financial measure |
|
|
|
|
|
|
|
| |
|
|
|
|
|
|
|
| Net income
(loss) |
$ |
(684 |
) |
|
$ |
1,744 |
|
|
$ |
(2,682 |
) |
|
$ |
298 |
|
| Income tax
expense (benefit) |
|
(165 |
) |
|
|
473 |
|
|
|
(673 |
) |
|
|
101 |
|
| Realized
investment gains, net |
|
(13 |
) |
|
|
(70 |
) |
|
|
(13 |
) |
|
|
(70 |
) |
| Unrealized
(gains) losses on equity securities, net |
|
(243 |
) |
|
|
(494 |
) |
|
|
(129 |
) |
|
|
1,881 |
|
| |
|
|
|
|
|
|
|
|
Non-GAAP operating income (loss) |
$ |
(1,105 |
) |
|
$ |
1,653 |
|
|
$ |
(3,497 |
) |
|
$ |
2,210 |
|
| |
|
|
|
|
|
|
|
| |
|
|
|
|
|
June 30, |
|
December 31, |
|
|
|
|
|
Selected balance sheet data |
2024 |
|
2023 |
|
|
|
|
| |
|
|
|
|
|
|
|
| Total cash
and investments |
$ |
256,525 |
|
|
$ |
265,368 |
|
|
|
|
|
|
Insurance subsidiaries |
|
248,857 |
|
|
|
259,253 |
|
|
|
|
|
|
Parent and other |
|
7,668 |
|
|
|
6,115 |
|
|
|
|
|
| Total
assets |
|
386,007 |
|
|
|
381,265 |
|
|
|
|
|
| Insurance
reserves and policyholder funds |
|
225,252 |
|
|
|
212,422 |
|
|
|
|
|
| Debt |
|
37,762 |
|
|
|
36,757 |
|
|
|
|
|
| Total
shareholders' equity |
|
100,672 |
|
|
|
107,275 |
|
|
|
|
|
| Book value
per common share |
|
4.67 |
|
|
|
4.99 |
|
|
|
|
|
| Statutory
capital and surplus |
|
|
|
|
|
|
|
|
Life and health |
|
32,689 |
|
|
|
38,299 |
|
|
|
|
|
|
Property and casualty |
|
51,967 |
|
|
|
51,774 |
|
|
|
|
|
| |
|
|
|
|
|
|
|
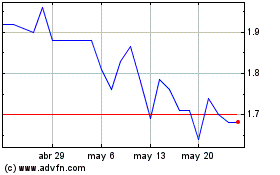
Atlantic American (NASDAQ:AAME)
Gráfica de Acción Histórica
De Mar 2025 a Abr 2025

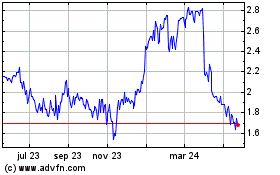
Atlantic American (NASDAQ:AAME)
Gráfica de Acción Histórica
De Abr 2024 a Abr 2025
