false
0001466026
0001466026
2024-07-29
2024-07-29
0001466026
MSBI:CommonStock0.01ParValueMember
2024-07-29
2024-07-29
0001466026
MSBI:DepositarySharesEachRepresenting140thInterestInShareOf7.750FixedrateResetNoncumulativePerpetualPreferredStockSeries2.00ParValueMember
2024-07-29
2024-07-29
iso4217:USD
xbrli:shares
iso4217:USD
xbrli:shares
United States
Securities And Exchange Commission
Washington, DC 20549
FORM 8-K
Current Report
Pursuant to Section 13 OR 15(d) of the Securities Exchange Act of 1934
Date of report (Date of earliest event reported): July 29, 2024
Midland States Bancorp, Inc.
(Exact Name of Registrant as Specified in Charter)
| Illinois |
001-35272 |
37-1233196 |
| (State or Other Jurisdiction of Incorporation) |
(Commission File Number) |
(IRS Employer Identification No.) |
| |
1201 Network Centre Drive
Effingham, Illinois 62401 |
|
| |
(Address of Principal Executive Offices) (Zip Code) |
|
Registrant’s
telephone number, including area code: (217) 342-7321
N/A
(Former Name or Former Address, if Changed Since Last Report.)
Check the appropriate box below if the Form 8-K filing is intended to simultaneously
satisfy the filing obligation of the registrant under any of the following provisions (see General Instruction A.2. below):
| ☐ | Written communications pursuant to Rule 425 under the Securities Act (17
CFR 230.425) |
| ☐ | Soliciting material pursuant to Rule 14a-12 under the Exchange Act (17 CFR
240.14a-12) |
| ☐ | Pre-commencement communications pursuant to Rule 14d-2(b) under the Exchange
Act (17 CFR 240.14d-2(b)) |
| ☐ | Pre-commencement communications pursuant to Rule 13e-4(c) under the Exchange
Act (17 CFR 240.13e-4(c)) |
Securities registered pursuant to Section 12(b) of the Act:
| Title of each class |
Trading Symbol(s) |
Name of each exchange on which registered |
| Common stock, $0.01 par value |
MSBI |
The Nasdaq Market LLC |
| Depositary Shares (each representing a 1/40th interest in a share of 7.750% Fixed-Rate Reset Non-Cumulative Perpetual Preferred Stock, Series A, $2.00 par value) |
MSBIP |
The Nasdaq Market LLC |
Indicate by check mark whether the registrant is an emerging growth company
as defined in Rule 405 of the Securities Act of 1933 (§230.405 of this chapter) or Rule 12b–2 of the Securities Exchange Act
of 1934 (§240.12b–2 of this chapter).
Emerging growth company ☐
If an emerging growth company, indicate by
check mark if the registrant has elected not to use the extended transition period for complying with any new or revised financial accounting
standards provided pursuant to Section 13(a) of the Exchange Act. ☐
| Item 7.01. | Regulation FD Disclosure. |
Midland States Bancorp, Inc. (the “Company”)
is filing an investor presentation (the “Presentation”) that will be used by the Company in meetings with investors and analysts.
A copy of the Presentation is attached hereto as Exhibit 99.1 and is incorporated herein by reference.
The information in this Item 7.01 and the attached
exhibits shall not be deemed “filed” for purposes of Section 18 of the Securities Exchange Act of 1934, as amended, nor shall
they be deemed incorporated by reference in any filing under the Securities Act of 1933, as amended, except as shall be expressly set
forth by specific reference in any such filing.
| Item 9.01 | Financial Statements and Exhibits. |
(d) Exhibits
SignatureS
Pursuant to the requirements of the Securities Exchange
Act of 1934, the registrant has duly caused this report to be signed on its behalf by the undersigned hereunto duly authorized.
| Date: July 29, 2024 | MIDLAND STATES BANCORP, INC. |
| | | |
| By: | /s/ Douglas J. Tucker |
| Name: | Douglas J. Tucker |
| Title: | Senior Vice President and Corporate Counsel |
Exhibit 99.1
1 Midland States Bancorp, Inc. NASDAQ: MSBI Investor Presentation July 2024
2 2 Forward - Looking Statements. This presentation may contain forward - looking statements within the meaning of the federal securities laws. Forward - looking statements expressing management’s current expectations, forecasts of future events or long - term goals may be based upon beliefs, expectations and assumptions of the Company’s management, and are generally identifiable by the use of words such as “believe,” “expect,” “anticipate,” “plan,” “intend,” “estimate,” “may,” “will,” “would,” “could,” “should” or other similar expressions. All statements in this presentation speak only as of the date they are made, and the Company undertakes no obligation to update any statement. A number of factors, many of which are beyond the ability of the Company to control or predict, could cause actual results to differ materially from those in its forward - looking statements including changes in interest rates and other general economic, business and political conditions, the impact of inflation, increased deposit volatility and potential regulatory developments. These risks and uncertainties should be considered in evaluating forward - looking statements, and undue reliance should not be placed on such statements. Additional information concerning the Company and its businesses, including additional factors that could materially affect the Company’s financial results, are included in the Company’s filings with the Securities and Exchange Commission. Use of Non - GAAP Financial Measures. This presentation may contain certain financial information determined by methods other than in accordance with accounting principles generally accepted in the United States (“GAAP”). These non - GAAP financial measures include “Adjusted Earnings,” "Adjusted Earnings Available to Common Shareholders," “Adjusted Diluted Earnings Per Common Share,” “Adjusted Return on Average Assets,” “Adjusted Return on Average Shareholders’ Equity,” “Adjusted Return on Average Tangible Common Equity,” “Adjusted Pre - Tax, Pre - Provision Earnings,” “Adjusted Pre - Tax, Pre - Provision Return on Average Assets,” “Efficiency Ratio,” “Tangible Common Equity to Tangible Assets,” “Tangible Book Value Per Share,” “Tangible Book Value Per Share excluding Accumulated Other Comprehensive Income,”and “Return on Average Tangible Common Equity.” The Company believes that these non - GAAP financial measures provide both management and investors a more complete understanding of the Company’s funding profile and profitability. These non - GAAP financial measures are supplemental and are not a substitute for any analysis based on GAAP financial measures. Not all companies use the same calculation of these measures; therefore this presentation may not be comparable to other similarly titled measures as presented by other companies. Reconciliations of these non - GAAP measures are provided in the Appendix section of this presentation.
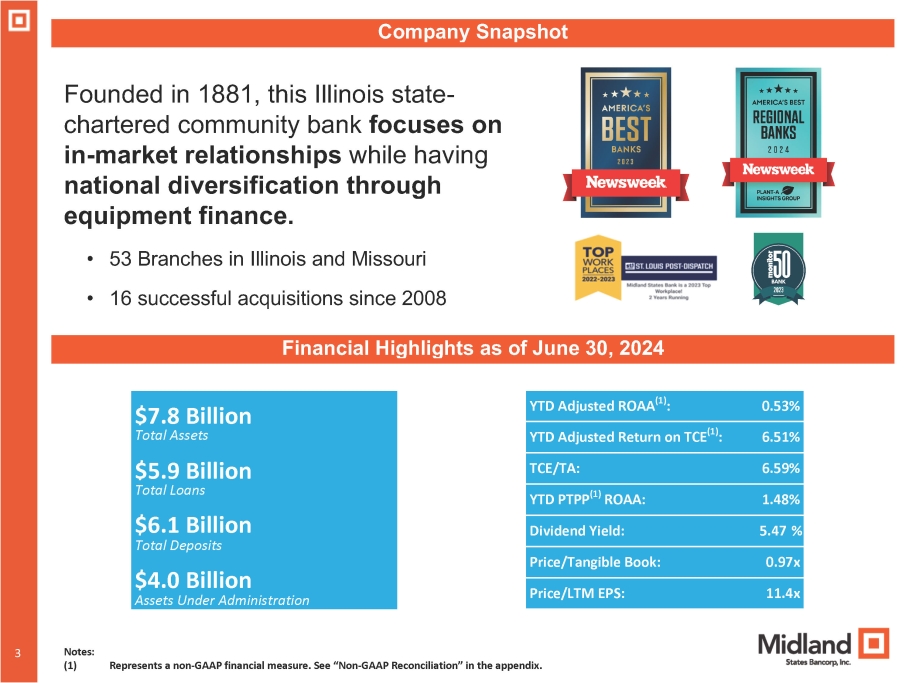
3 3 Company Snapshot Financial Highlights as of June 30, 2024 $7.8 Billion Total Assets $5.9 Billion Total Loans $6.1 Billion Total Deposits $4.0 Billion Assets Under Administration 0.53% YTD Adjusted ROAA (1) : 6.51% YTD Adjusted Return on TCE (1) : 6.59% TCE/TA: 1.48% YTD PTPP (1) ROAA: Dividend Yield: 5.47 % 0.97x Price/Tangible Book: 11.4x Price/LTM EPS: Notes: (1) Represents a non - GAAP financial measure. See “Non - GAAP Reconciliation” in the appendix. Founded in 1881, this Illinois state - chartered community bank focuses on in - market relationships while having national diversification through equipment finance. • 53 Branches in Illinois and Missouri • 16 successful acquisitions since 2008
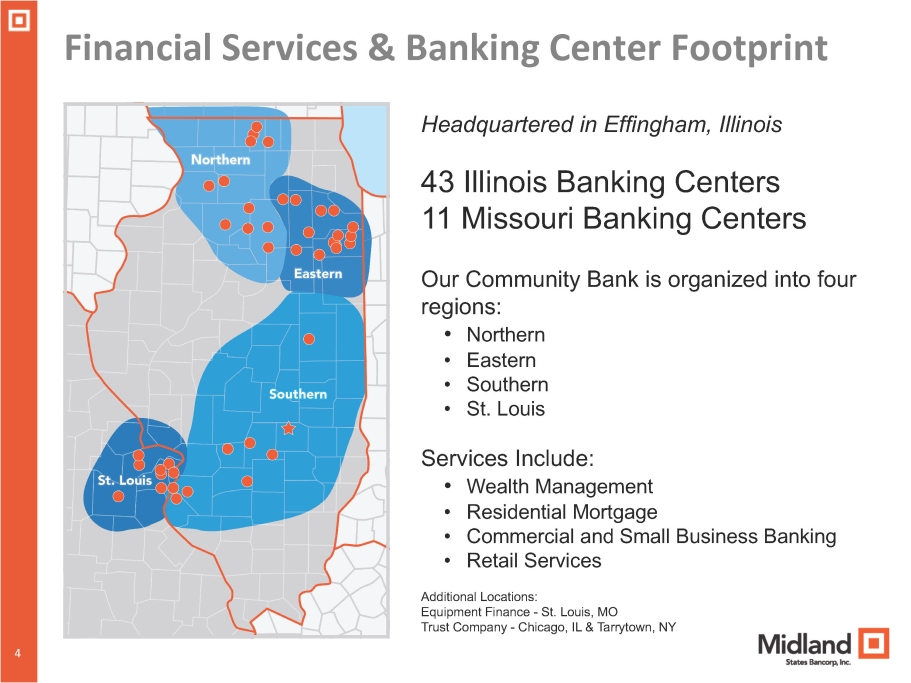
4 Financial Services & Banking Center Footprint Headquartered in Effingham, Illinois 43 Illinois Banking Centers 11 Missouri Banking Centers Our Community Bank is organized into four regions: • Northern • Eastern • Southern • St. Louis Services Include: • Wealth Management • Residential Mortgage • Commercial and Small Business Banking • Retail Services Additional Locations: Equipment Finance - St. Louis, MO Trust Company - Chicago, IL & Tarrytown, NY 4
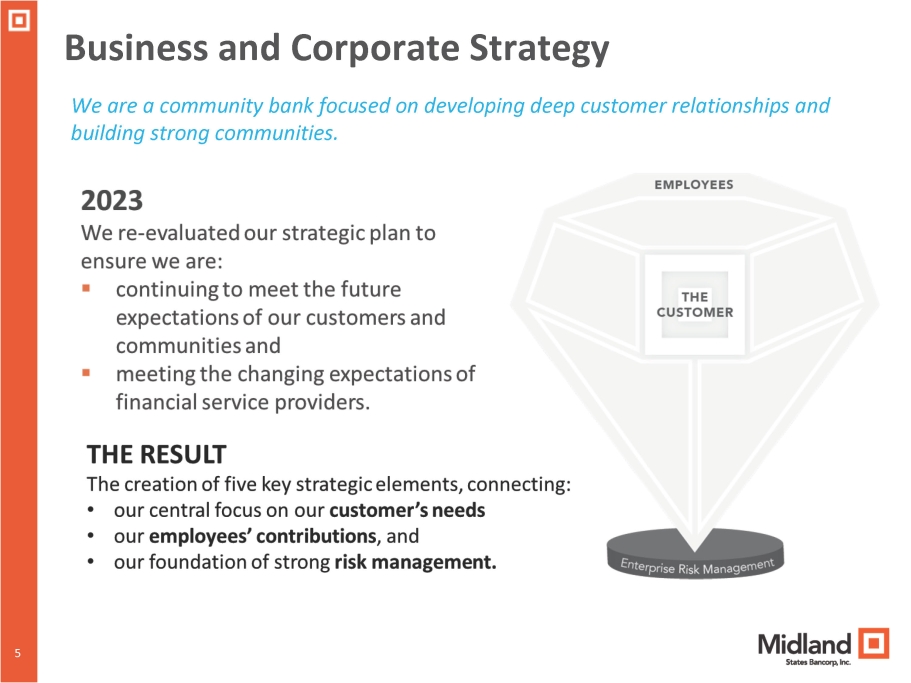
5 Business and Corporate Strategy We are a community bank focused on developing deep customer relationships and building strong communities. 5
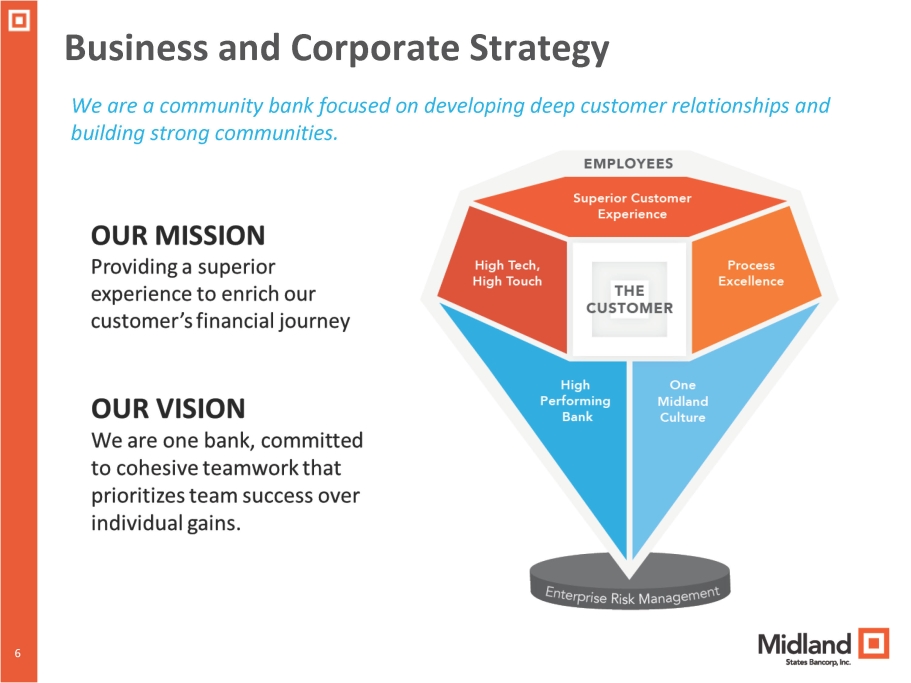
6 Business and Corporate Strategy We are a community bank focused on developing deep customer relationships and building strong communities. 6
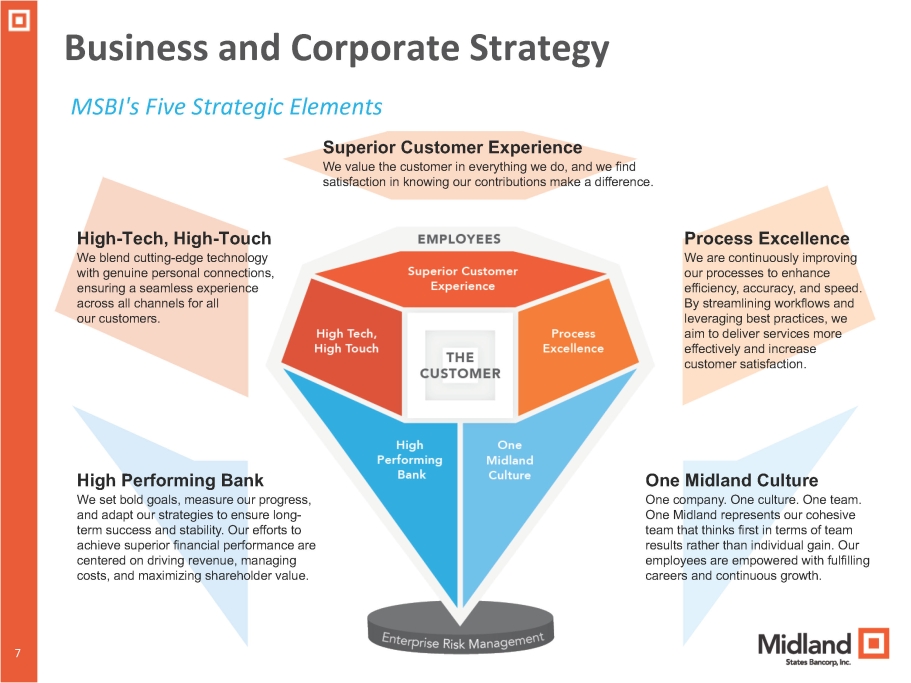
7 Business and Corporate Strategy MSBI's Five Strategic Elements Superior Customer Experience We value the customer in everything we do, and we find satisfaction in knowing our contributions make a difference. 7 Process Excellence We are continuously improving our processes to enhance efficiency, accuracy, and speed. By streamlining workflows and leveraging best practices, we aim to deliver services more effectively and increase customer satisfaction. High - Tech, High - Touch We blend cutting - edge technology with genuine personal connections, ensuring a seamless experience across all channels for all our customers. One Midland Culture One company. One culture. One team. One Midland represents our cohesive team that thinks first in terms of team results rather than individual gain. Our employees are empowered with fulfilling careers and continuous growth. High Performing Bank We set bold goals, measure our progress, and adapt our strategies to ensure long - term success and stability. Our efforts to achieve superior financial performance are centered on driving revenue, managing costs, and maximizing shareholder value.
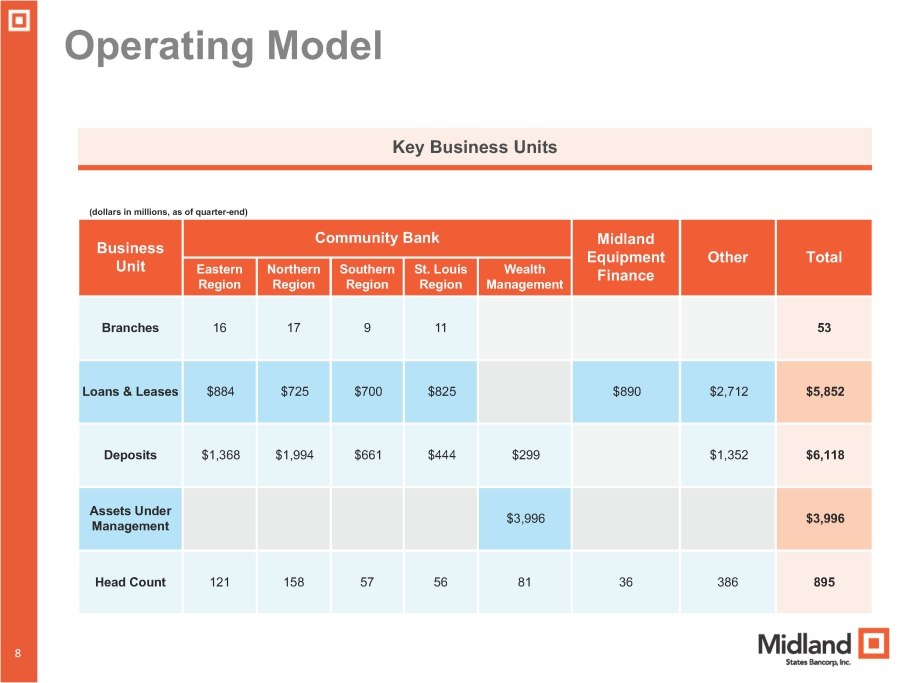
8 Operating Model (dollars in millions, as of quarter - end) Total Other Midland Equipment Finance Community Bank Business Unit Wealth Management St. Louis Region Southern Region Northern Region Eastern Region 53 11 9 17 16 Branches $5,852 $2,712 $890 $825 $700 $725 $884 Loans & Leases $6,118 $1,352 $299 $444 $661 $1,994 $1,368 Deposits $3,996 $3,996 Assets Under Management 895 386 36 81 56 57 158 121 Head Count Key Business Units 8
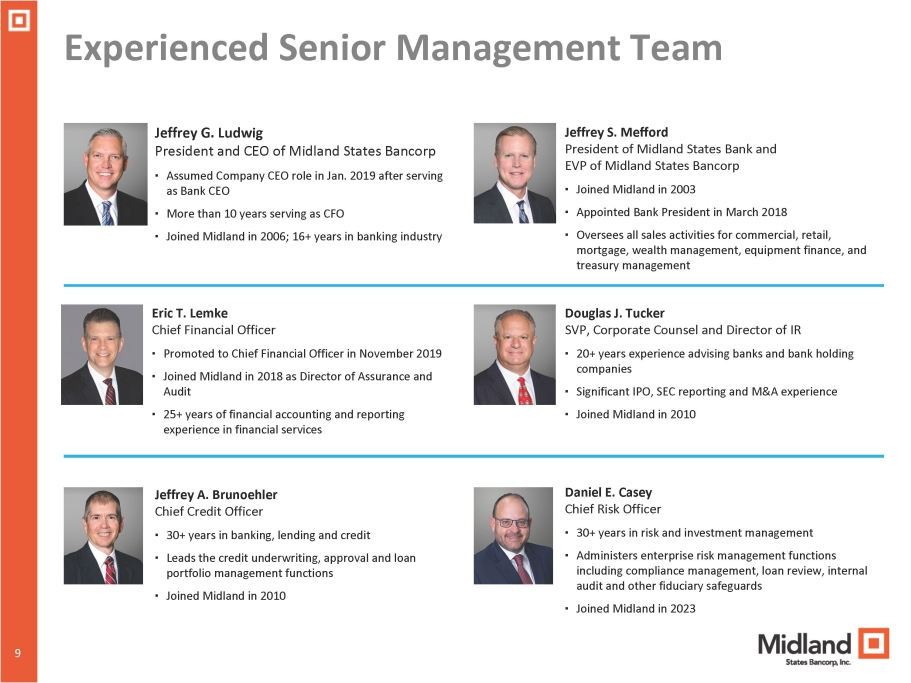
9 Experienced Senior Management Team Jeffrey G. Ludwig President and CEO of Midland States Bancorp ▪ Assumed Company CEO role in Jan. 2019 after serving as Bank CEO ▪ More than 10 years serving as CFO ▪ Joined Midland in 2006; 16+ years in banking industry Jeffrey S. Mefford President of Midland States Bank and EVP of Midland States Bancorp ▪ Joined Midland in 2003 ▪ Appointed Bank President in March 2018 ▪ Oversees all sales activities for commercial, retail, mortgage, wealth management, equipment finance, and treasury management Douglas J. Tucker SVP, Corporate Counsel and Director of IR ▪ 20+ years experience advising banks and bank holding companies ▪ Significant IPO, SEC reporting and M&A experience ▪ Joined Midland in 2010 Eric T. Lemke Chief Financial Officer ▪ Promoted to Chief Financial Officer in November 2019 ▪ Joined Midland in 2018 as Director of Assurance and Audit ▪ 25+ years of financial accounting and reporting experience in financial services Daniel E. Casey Chief Risk Officer ▪ 30+ years in risk and investment management ▪ Administers enterprise risk management functions including compliance management, loan review, internal audit and other fiduciary safeguards ▪ Joined Midland in 2023 Jeffrey A. Brunoehler Chief Credit Officer ▪ 30+ years in banking, lending and credit ▪ Leads the credit underwriting, approval and loan portfolio management functions ▪ Joined Midland in 2010 9
Investment Summary and Strategic Initiatives 10 10 • Profitable growth and improved efficiencies resulting in higher EPS and increased returns over the past few years • Strengthened commercial banking team and increased presence in faster growing markets driving high quality in - market loan production and consistent inflows of new commercial deposits • Wealth Management business focused on more effectively capitalizing on cross - selling opportunities and increasing organic growth rate • More conservative approach to new loan production adopted in light of current environment until economic conditions improve • Well positioned to capitalize on the current environment to add new commercial and retail deposit relationships • Banking - as - a - Service foundation being developed and expected to start making a contribution in 2024
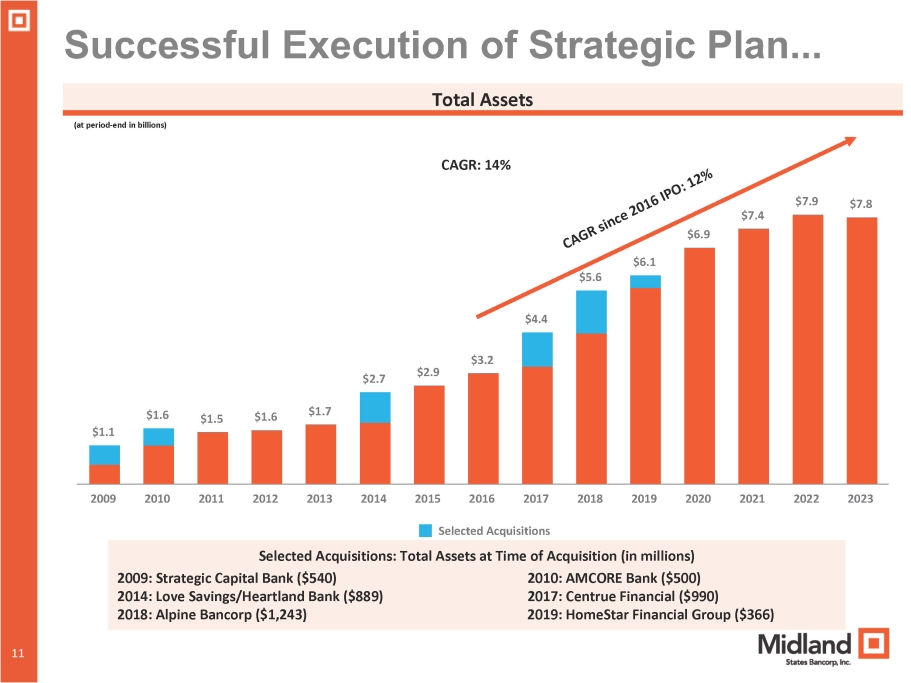
Successful Execution of Strategic Plan... Total Assets (at period - end in billions) $1.1 $1.6 $1.5 $1.6 $1.7 $2.7 $2.9 $6.1 $5.6 $4.4 $3.2 $7.4 $6.9 $7.9 $7.8 2015 2016 2017 Selected Acquisitions 2009 2010 2011 2012 2013 2014 2018 2019 2020 2021 2022 2023 10 11 CAGR: 14% Selected Acquisitions: Total Assets at Time of Acquisition (in millions) 2009: Strategic Capital Bank ($540) 2010: AMCORE Bank ($500) 2014: Love Savings/Heartland Bank ($889) 2017: Centrue Financial ($990) 2018: Alpine Bancorp ($1,243) 2019: HomeStar Financial Group ($366)
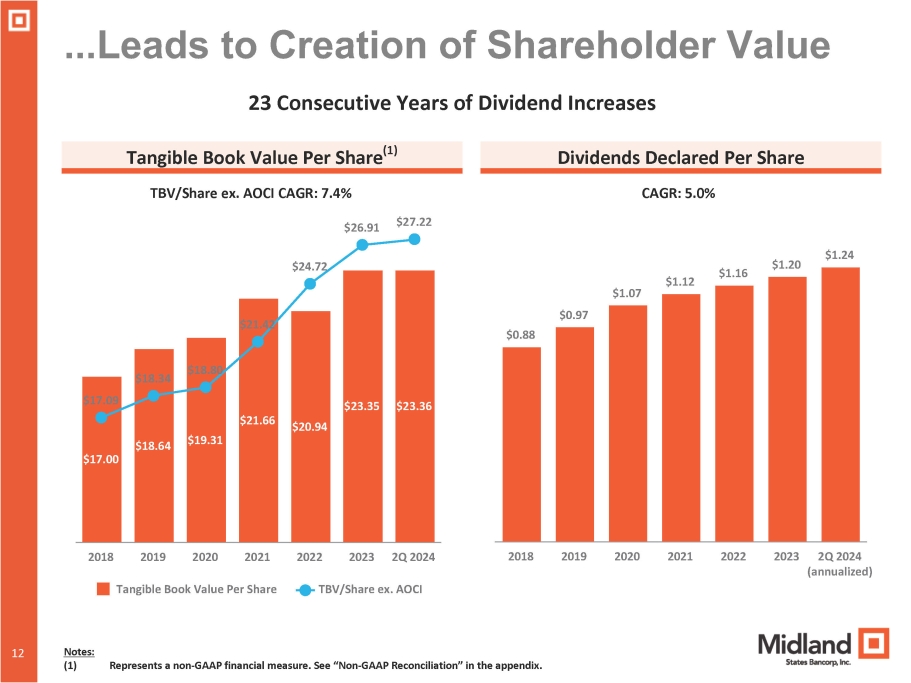
...Leads to Creation of Shareholder Value $17.00 $18.64 $19.31 $21.66 $20.94 $23.35 $23.36 $17.09 $18.34 $18.80 $21.42 $24.72 $26.91 $27.22 2018 2019 2020 2021 2022 2023 2Q 2024 Tangible Book Value Per Share TBV/Share ex. AOCI 23 Consecutive Years of Dividend Increases Tangible Book Value Per Share (1) Dividends Declared Per Share TBV/Share ex. AOCI CAGR: 7.4% CAGR: 5.0% $0.88 12 12 Notes: (1) Represents a non - GAAP financial measure. See “Non - GAAP Reconciliation” in the appendix. $0.97 $1.07 $1.12 $1.16 $1.20 $1.24 2018 2019 2020 2021 2022 2023 2Q 2024 (annualized)
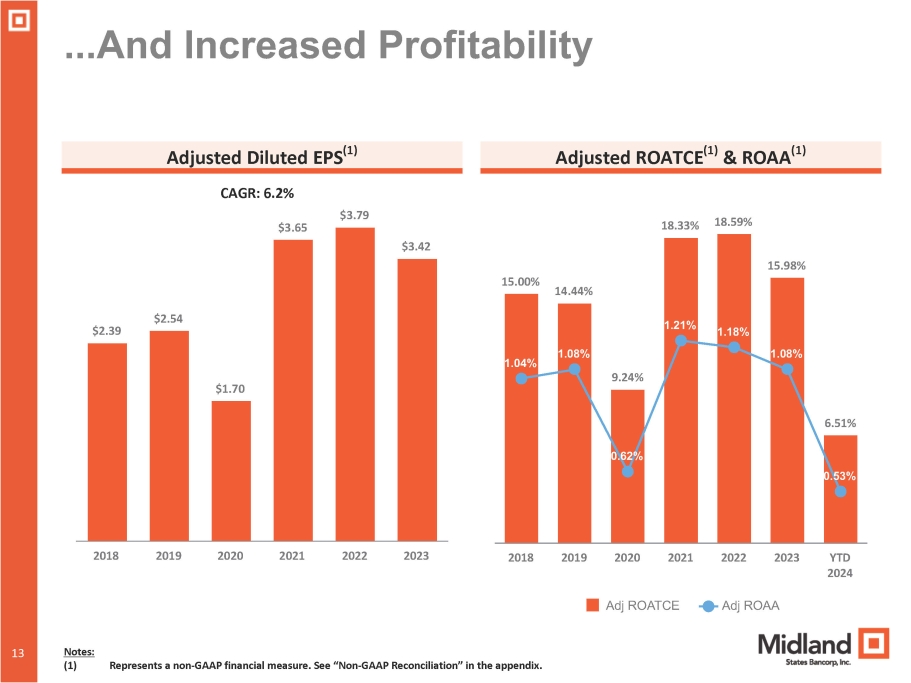
...And Increased Profitability Adjusted Diluted EPS (1) CAGR: 6.2% Adjusted ROATCE (1) & ROAA (1) 15.00% 14.44% 9.24% 18.33% 18.59% 15.98% 6.51% 1.04% 1.08% 0.62% 1.21% 1.18% 1.08% 0.53% Adj ROATCE Adj ROAA 2018 2019 2020 2021 2022 2023 YTD 2024 $2.39 12 13 Notes: (1) Represents a non - GAAP financial measure. See “Non - GAAP Reconciliation” in the appendix. $2.54 $1.70 $3.65 $3.79 $3.42 2018 2019 2020 2021 2022 2023
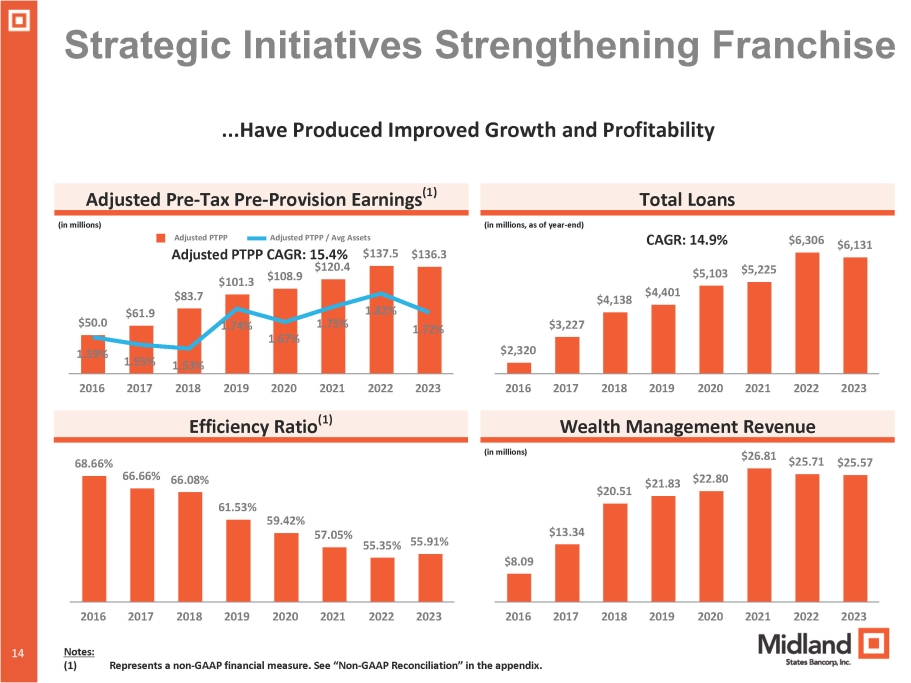
Strategic Initiatives Strengthening Franchise ...Have Produced Improved Growth and Profitability Adjusted Pre - Tax Pre - Provision Earnings (1) (in millions) Total Loans (in millions, as of year - end) 2016 2017 2018 2019 2020 2021 2022 2023 Efficiency Ratio (1) 2016 2017 2018 2019 2020 2021 2022 2023 Wealth Management Revenue (in millions) $50.0 $61.9 $83.7 $101.3 $108.9 $120.4 $137.5 $136.3 1.59% 1.55% 1.53% 1.74% 1.67% 1.75% 1.82% 1.72% Adjusted PTPP Adjusted PTPP / Avg Assets Adjusted PTPP CAGR: 15.4% $2,320 $3,227 $4,138 $4,401 $5,103 $5,225 $6,306 $6,131 CAGR: 14.9% 68.66% 66.66% 66.08% 61.53% 59.42% 57.05% 55.35% 55.91% 2016 2017 2018 2019 2020 2021 2022 2023 $8.09 12 14 Notes: (1) Represents a non - GAAP financial measure. See “Non - GAAP Reconciliation” in the appendix. $13.34 $20.51 $21.83 $22.80 $26.81 $25.71 $25.57 2016 2017 2018 2019 2020 2021 2022 2023
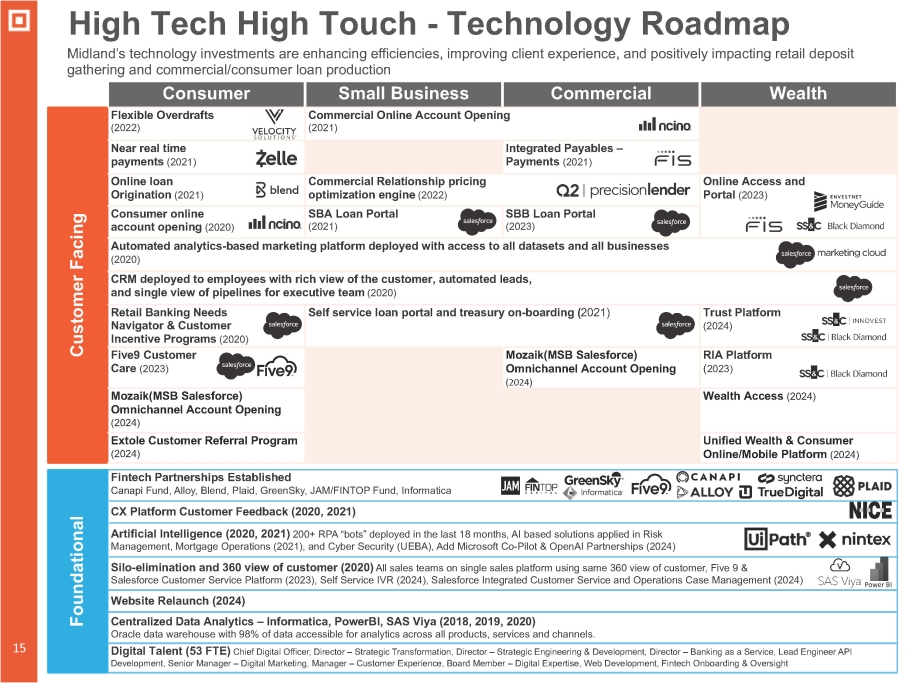
High Tech High Touch - Technology Roadmap Midland’s technology investments are enhancing efficiencies, improving client experience, and positively impacting retail deposit gathering and commercial/consumer loan production Fintech Partnerships Established Canapi Fund, Alloy, Blend, Plaid, GreenSky, JAM/FINTOP Fund, Informatica Foundational CX Platform Customer Feedback (2020, 2021) Artificial Intelligence (2020, 2021) 200+ RPA “bots” deployed in the last 18 months, AI based solutions applied in Risk Management, Mortgage Operations (2021), and Cyber Security (UEBA), Add Microsoft Co - Pilot & OpenAI Partnerships (2024) Silo - elimination and 360 view of customer (2020) All sales teams on single sales platform using same 360 view of customer, Five 9 & Salesforce Customer Service Platform (2023), Self Service IVR (2024), Salesforce Integrated Customer Service and Operations Case Management (2024) Website Relaunch (2024) Centralized Data Analytics – Informatica, PowerBI, SAS Viya (2018, 2019, 2020) Oracle data warehouse with 98% of data accessible for analytics across all products, services and channels. Digital Talent (53 FTE) Chief Digital Officer, Director – Strategic Transformation, Director – Strategic Engineering & Development, Director – Banking as a Service, Lead Engineer API Development, Senior Manager – Digital Marketing, Manager – Customer Experience, Board Member – Digital Expertise, Web Development, Fintech Onboarding & Oversight Customer Facing Wealth Commercial Small Business Consumer Commercial Online Account Opening (2021) Flexible Overdrafts (2022) Integrated Payables – Payments (2021) Near real time payments (2021) Online Access and Portal (2023) Commercial Relationship pricing optimization engine (2022) Online loan Origination (2021) SBB Loan Portal (2023) SBA Loan Portal (2021) Consumer online account opening (2020) Automated analytics - based marketing platform deployed with access to all datasets and all businesses (2020) CRM deployed to employees with rich view of the customer, automated leads, and single view of pipelines for executive team (2020) Trust Platform (2024) Self service loan portal and treasury on - boarding ( 2021) Retail Banking Needs Navigator & Customer Incentive Programs (2020) RIA Platform ( 2023) Mozaik(MSB Salesforce) Omnichannel Account Opening (2024) Five9 Customer Care (2023) Wealth Access (2024) Mozaik(MSB Salesforce) Omnichannel Account Opening (2024) Unified Wealth & Consumer Online/Mobile Platform (2024) Extole Customer Referral Program (2024) 15
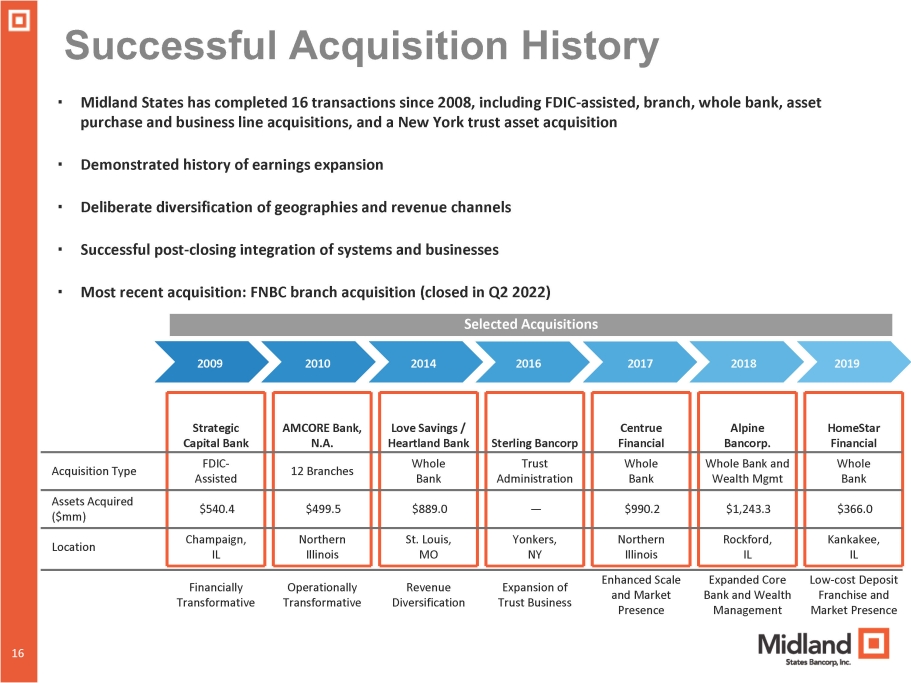
Successful Acquisition History ▪ Midland States has completed 16 transactions since 2008, including FDIC - assisted, branch, whole bank, asset purchase and business line acquisitions, and a New York trust asset acquisition ▪ Demonstrated history of earnings expansion ▪ Deliberate diversification of geographies and revenue channels ▪ Successful post - closing integration of systems and businesses ▪ Most recent acquisition: FNBC branch acquisition (closed in Q2 2022) HomeStar Alpine Centrue Love Savings / AMCORE Bank, Strategic Financial Bancorp. Financial Sterling Bancorp Heartland Bank N.A. Capital Bank Whole Bank Whole Bank and Wealth Mgmt Whole Bank Trust Administration Whole Bank 12 Branches Acquisition Type A FDIC - d ssiste $366.0 $1,243.3 $990.2 — $889.0 $499.5 Assets Acquired $540.4 ($mm) Kankakee, Rockford, Northern Yonkers, St. Louis, Northern Location Champaign, IL IL Illinois NY MO Illinois IL 16 16 Financially Transformative Operationally Transformative Revenue Diversification Expansion of Trust Business Enhanced Scale and Market Presence Expanded Core Bank and Wealth Management Low - cost Deposit Franchise and Market Presence 2009 2010 2014 2016 2017 2018 2019 Selected Acquisitions

Loan Portfolio and Asset Quality 16 17
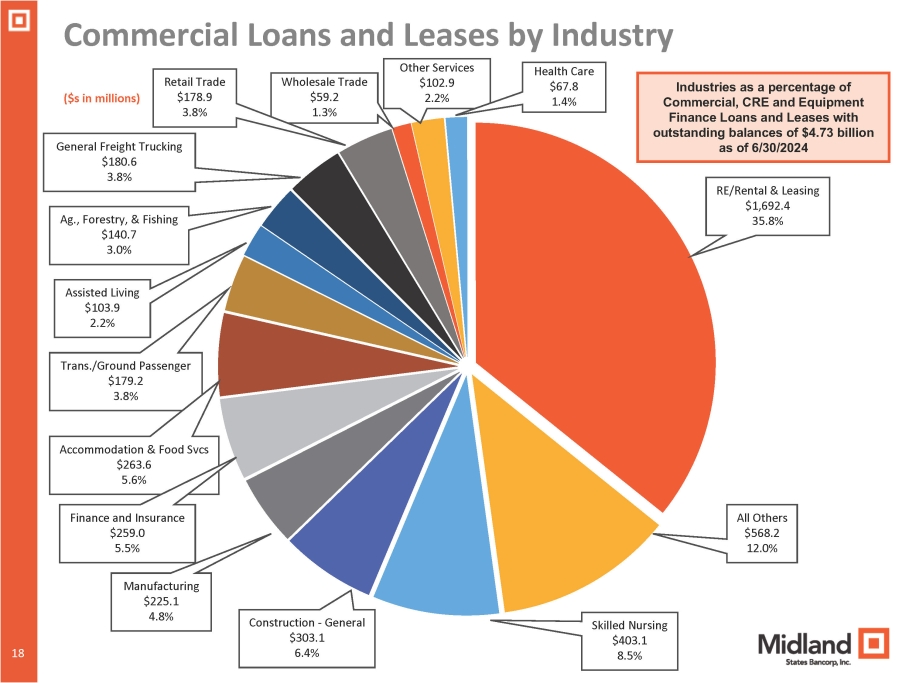
18 18 ($s in millions) RE/Rental & Leasing $1,692.4 35.8% All Others $568.2 12.0% Skilled Nursing $403.1 8.5% Construction - General $303.1 6.4% Manufacturing $225.1 4.8% Accommodation & Food Svcs $263.6 5.6% Assisted Living $103.9 2.2% Trans./Ground Passenger $179.2 3.8% Ag., Forestry, & Fishing $140.7 3.0% General Freight Trucking $180.6 3.8% Wholesale Trade $59.2 1.3% Retail Trade $178.9 3.8% Other Services $102.9 2.2% Commercial Loans and Leases by Industry Health Care $67.8 1.4% Finance and Insurance $259.0 5.5% Industries as a percentage of Commercial, CRE and Equipment Finance Loans and Leases with outstanding balances of $4.73 billion as of 6/30/2024
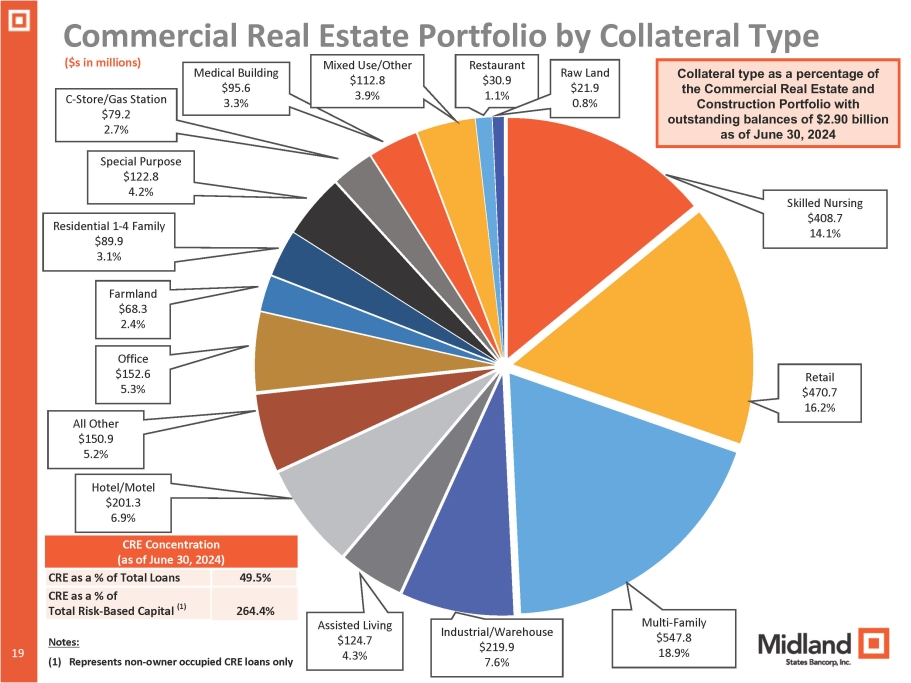
19 Commercial Real Estate Portfolio by Collateral Type 19 CRE Concentration (as of June 30, 2024) 49.5% CRE as a % of Total Loans 264.4% CRE as a % of Total Risk - Based Capital (1) Notes: (1) Represents non - owner occupied CRE loans only ($s in millions) Skilled Nursing $408.7 14.1% Retail $470.7 16.2% Multi - Family $547.8 18.9% Industrial/Warehouse $219.9 7.6% Assisted Living $124.7 4.3% All Other $150.9 5.2% Hotel/Motel $201.3 6.9% Office $152.6 5.3% Farmland $68.3 2.4% Residential 1 - 4 Family $89.9 3.1% Restaurant $30.9 1.1% Medical Building $95.6 3.3% Special Purpose $122.8 4.2% C - Store/Gas Station $79.2 2.7% Mixed Use/Other $112.8 3.9% Raw Land $21.9 0.8% Collateral type as a percentage of the Commercial Real Estate and Construction Portfolio with outstanding balances of $2.90 billion as of June 30, 2024
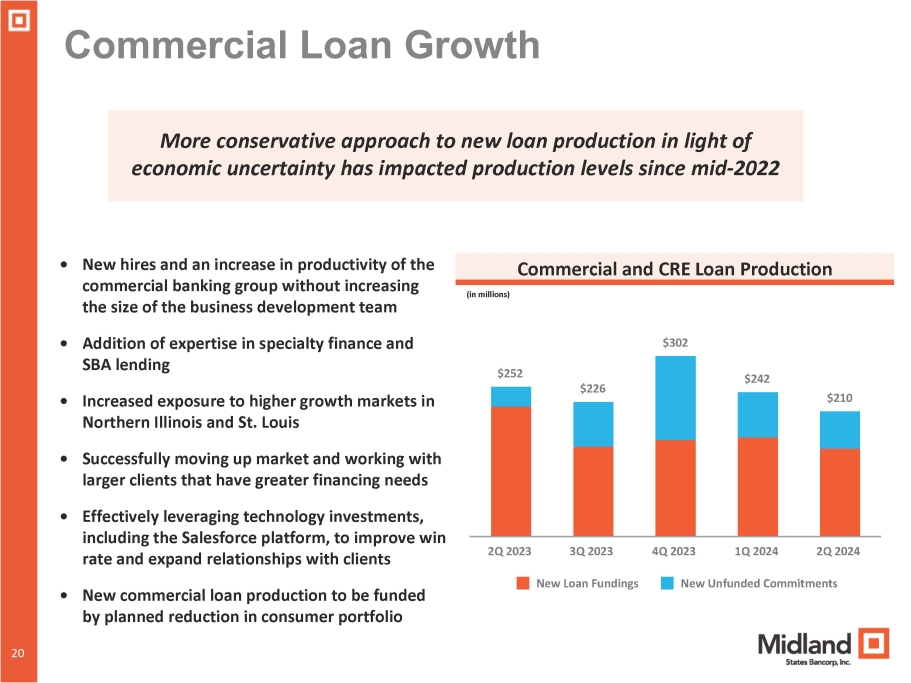
20 Commercial Loan Growth 20 • New hires and an increase in productivity of the commercial banking group without increasing the size of the business development team • Addition of expertise in specialty finance and SBA lending • Increased exposure to higher growth markets in Northern Illinois and St. Louis • Successfully moving up market and working with larger clients that have greater financing needs • Effectively leveraging technology investments, including the Salesforce platform, to improve win rate and expand relationships with clients • New commercial loan production to be funded by planned reduction in consumer portfolio Commercial and CRE Loan Production (in millions) More conservative approach to new loan production in light of economic uncertainty has impacted production levels since mid - 2022 $252 $226 $302 $242 $210 New Loan Fundings 4Q 2023 1Q 2024 2Q 2024 New Unfunded Commitments 2Q 2023 3Q 2023
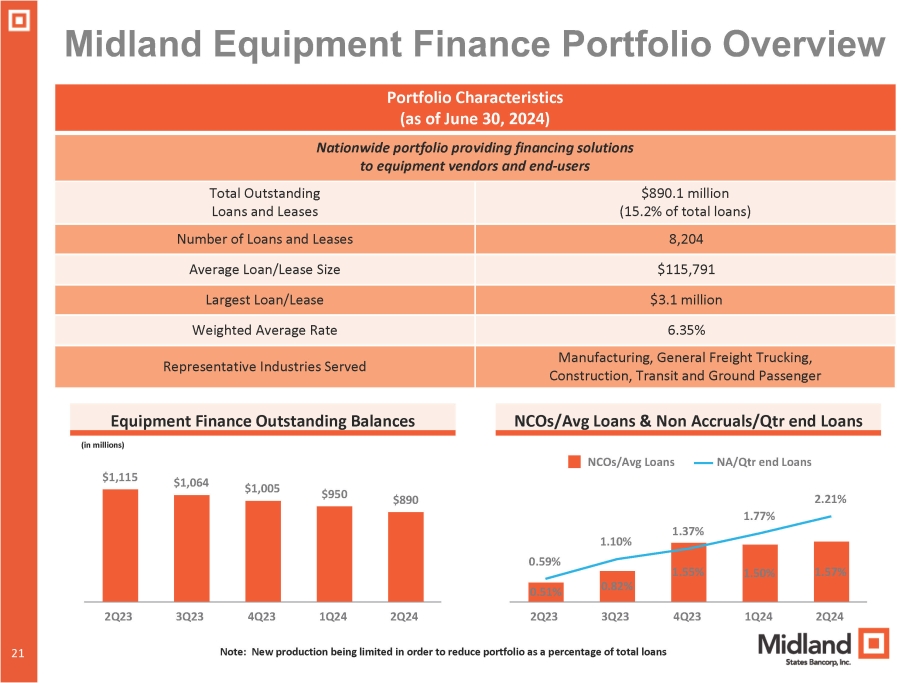
21 Midland Equipment Finance Portfolio Overview 21 Portfolio Characteristics (as of June 30, 2024) Nationwide portfolio providing financing solutions to equipment vendors and end - users $890.1 million (15.2% of total loans) Total Outstanding Loans and Leases 8,204 Number of Loans and Leases $115,791 Average Loan/Lease Size $3.1 million Largest Loan/Lease 6.35% Weighted Average Rate Manufacturing, General Freight Trucking, Construction, Transit and Ground Passenger Representative Industries Served Equipment Finance Outstanding Balances (in millions) $1,115 $1,064 $1,005 $950 $890 2Q23 3Q23 4Q23 1Q24 2Q24 2Q23 3Q23 Note: New production being limited in order to reduce portfolio as a percentage of total loans 0.51% 0.82% 1.55% 1.50% 1.57% 0.59% 1.10% 1.37% 1.77% 2.21% NCOs/Avg Loans & Non Accruals/Qtr end Loans NCOs/Avg Loans NA/Qtr end Loans 4Q23 1Q24 2Q24
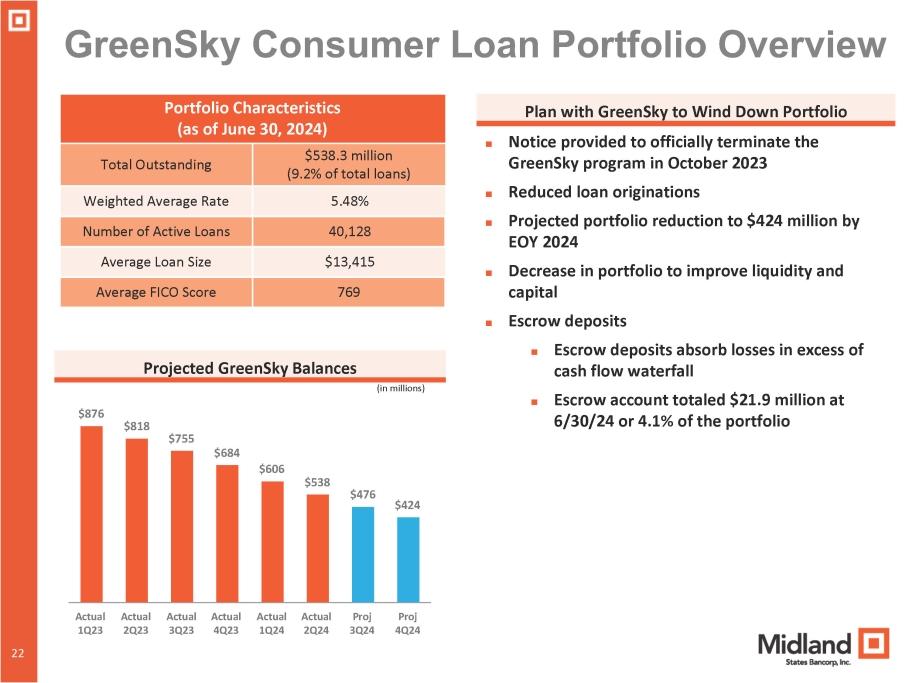
GreenSky Consumer Loan Portfolio Overview Portfolio Characteristics (as of June 30, 2024) $538.3 million (9.2% of total loans) Total Outstanding 5.48% Weighted Average Rate 40,128 Number of Active Loans $13,415 Average Loan Size 769 Average FICO Score Projected GreenSky Balances $876 $818 $755 $684 $606 $538 $476 $424 Actual 1Q23 Actual 2Q23 Actual Actual 3Q23 4Q23 Actual Actual Proj Proj 1Q24 2Q24 3Q24 4Q24 Plan with GreenSky to Wind Down Portfolio ■ Notice provided to officially terminate the GreenSky program in October 2023 ■ Reduced loan originations ■ Projected portfolio reduction to $424 million by EOY 2024 ■ Decrease in portfolio to improve liquidity and capital ■ Escrow deposits 22 22 ■ Escrow deposits absorb losses in excess of cash flow waterfall ■ Escrow account totaled $21.9 million at 6/30/24 or 4.1% of the portfolio (in millions)
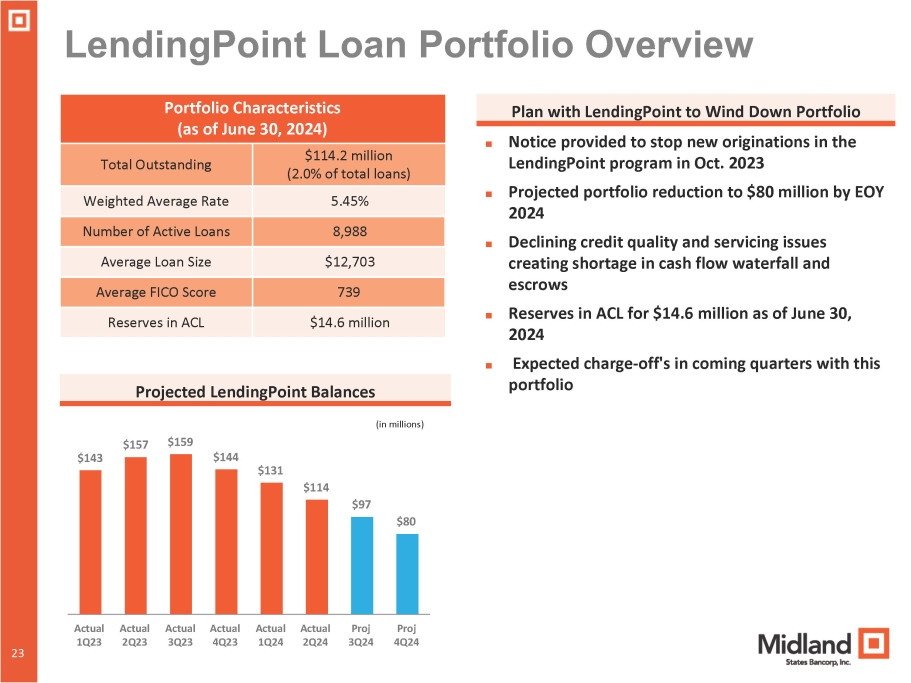
23 LendingPoint Loan Portfolio Overview Portfolio Characteristics (as of June 30, 2024) $114.2 million (2.0% of total loans) Total Outstanding 5.45% Weighted Average Rate 8,988 Number of Active Loans $12,703 Average Loan Size 739 Average FICO Score $14.6 million Reserves in ACL Projected LendingPoint Balances $143 $157 $159 $144 $131 $114 $97 $80 Actual 1Q23 Actual 2Q23 Actual Actual 3Q23 4Q23 Actual Actual Proj Proj 1Q24 2Q24 3Q24 4Q24 Plan with LendingPoint to Wind Down Portfolio ■ Notice provided to stop new originations in the LendingPoint program in Oct. 2023 ■ Projected portfolio reduction to $80 million by EOY 2024 ■ Declining credit quality and servicing issues creating shortage in cash flow waterfall and escrows ■ Reserves in ACL for $14.6 million as of June 30, 2024 ■ Expected charge - off's in coming quarters with this portfolio 23 (in millions)
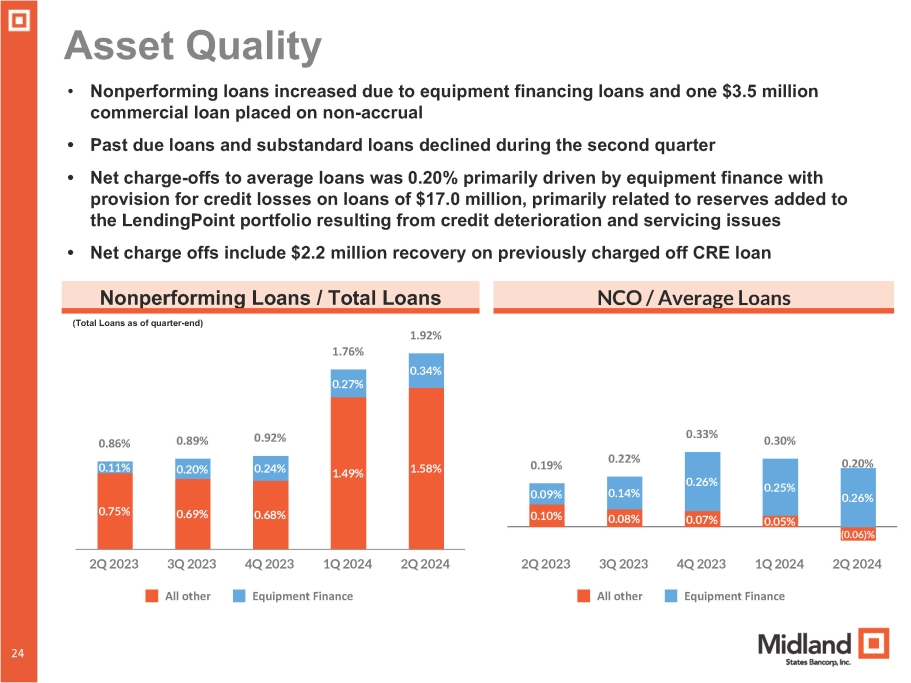
Asset Quality (Total Loans as of quarter - end) • Nonperforming loans increased due to equipment financing loans and one $3.5 million commercial loan placed on non - accrual • Past due loans and substandard loans declined during the second quarter • Net charge - offs to average loans was 0.20% primarily driven by equipment finance with provision for credit losses on loans of $17.0 million, primarily related to reserves added to the LendingPoint portfolio resulting from credit deterioration and servicing issues • Net charge offs include $2.2 million recovery on previously charged off CRE loan Nonperforming Loans / Total Loans NCO / Average Loans 0.75% 0.69% 0.68% 1.49% 1.58% 0.92% 0.89% 0.86% 0.24% 0.20% 0.11% 1.92% 1.76% 0.34% 0.27% All other 4Q 2023 1Q 2024 Equipment Finance 2Q 2023 3Q 2023 2Q 2024 0.10% 0.08% 0.07% 0.05% (0.06)% 0.09% 0.14% 0.26% 0.25% 0.26% 0.19% 0.22% 0.33% 0.30% 0.20% All other 4Q 2023 1Q 2024 Equipment Finance 24 24 2Q 2023 3Q 2023 2Q 2024
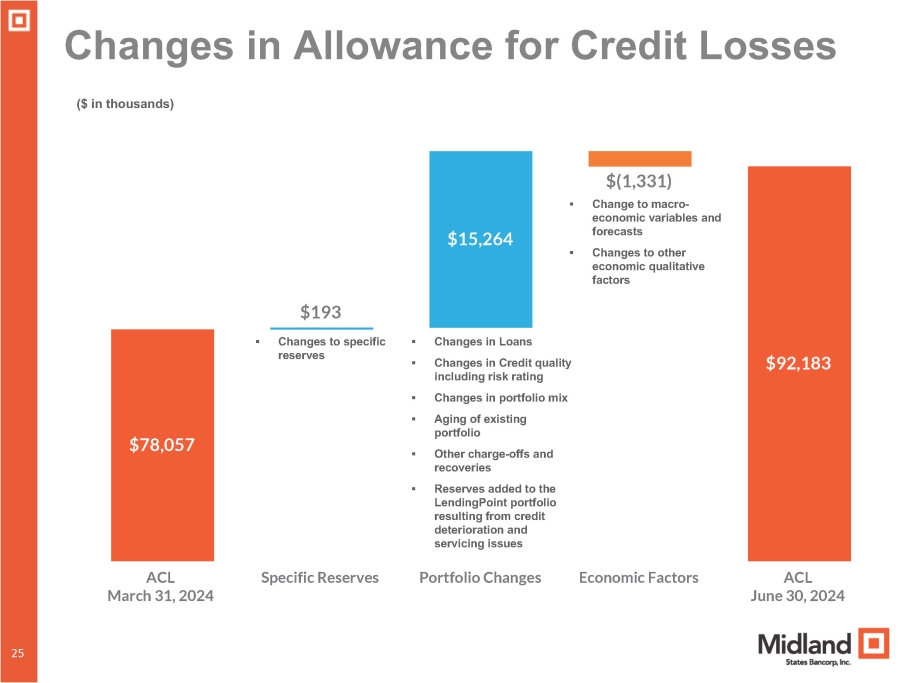
$78,057 24 25 $193 $15,264 $(1,331) ▪ Change to macro - economic variables and forecasts ▪ Changes to other economic qualitative factors $92,183 ACL March 31, 2024 Specific Reserves Portfolio Changes Economic Factors ACL June 30, 2024 Changes in Allowance for Credit Losses ($ in thousands) ▪ Changes to specific reserves ▪ Changes in Loans ▪ Changes in Credit quality including risk rating ▪ Changes in portfolio mix ▪ Aging of existing portfolio ▪ Other charge - offs and recoveries ▪ Reserves added to the LendingPoint portfolio resulting from credit deterioration and servicing issues
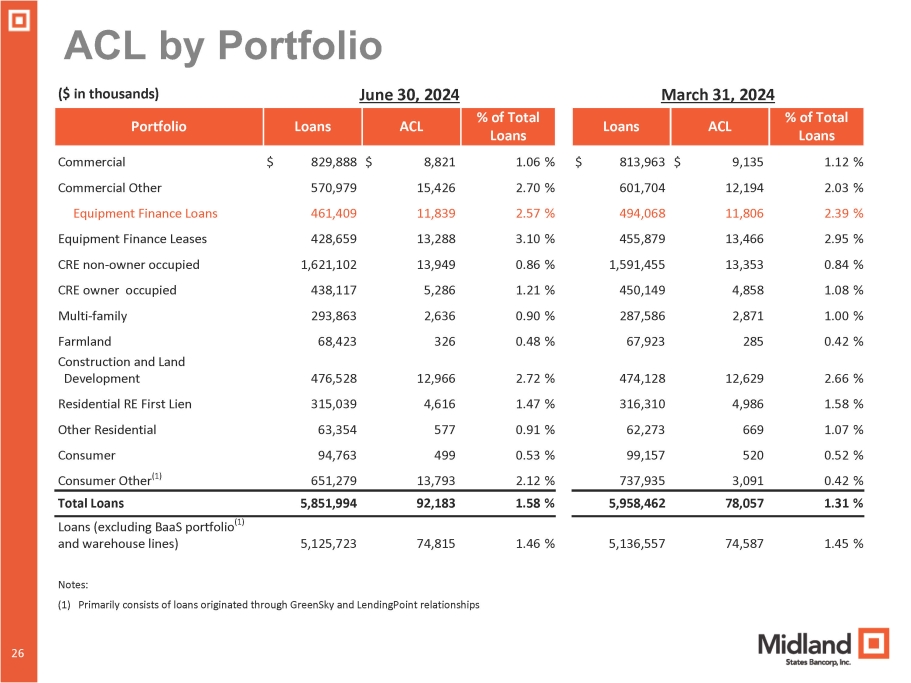
ACL by Portfolio 24 26 % of Total Loans ACL Loans % of Total Loans ACL Loans Portfolio ($ in thousands) June 30, 2024 March 31, 2024 1.12 % $ 9,135 $ 813,963 1.06 % $ 8,821 $ 829,888 Commercial 2.03 % 12,194 601,704 2.70 % 15,426 570,979 Commercial Other 2.39 % 11,806 494,068 2.57 % 11,839 461,409 Equipment Finance Loans 2.95 % 13,466 455,879 3.10 % 13,288 428,659 Equipment Finance Leases 0.84 % 13,353 1,591,455 0.86 % 13,949 1,621,102 CRE non - owner occupied 1.08 % 4,858 450,149 1.21 % 5,286 438,117 CRE owner occupied 1.00 % 2,871 287,586 0.90 % 2,636 293,863 Multi - family 0.42 % 285 67,923 0.48 % 326 68,423 Farmland 2.66 % 12,629 474,128 2.72 % 12,966 476,528 Construction and Land Development 1.58 % 4,986 316,310 1.47 % 4,616 315,039 Residential RE First Lien 1.07 % 669 62,273 0.91 % 577 63,354 Other Residential 0.52 % 520 99,157 0.53 % 499 94,763 Consumer 0.42 % 3,091 737,935 2.12 % 13,793 651,279 Consumer Other (1) 1.31 % 78,057 5,958,462 1.58 % 92,183 5,851,994 Total Loans 1.45 % 74,587 5,136,557 1.46 % 74,815 5,125,723 Loans (excluding BaaS portfolio (1) and warehouse lines) Notes: (1) Primarily consists of loans originated through GreenSky and LendingPoint relationships

Recent Financial Trends 24 27
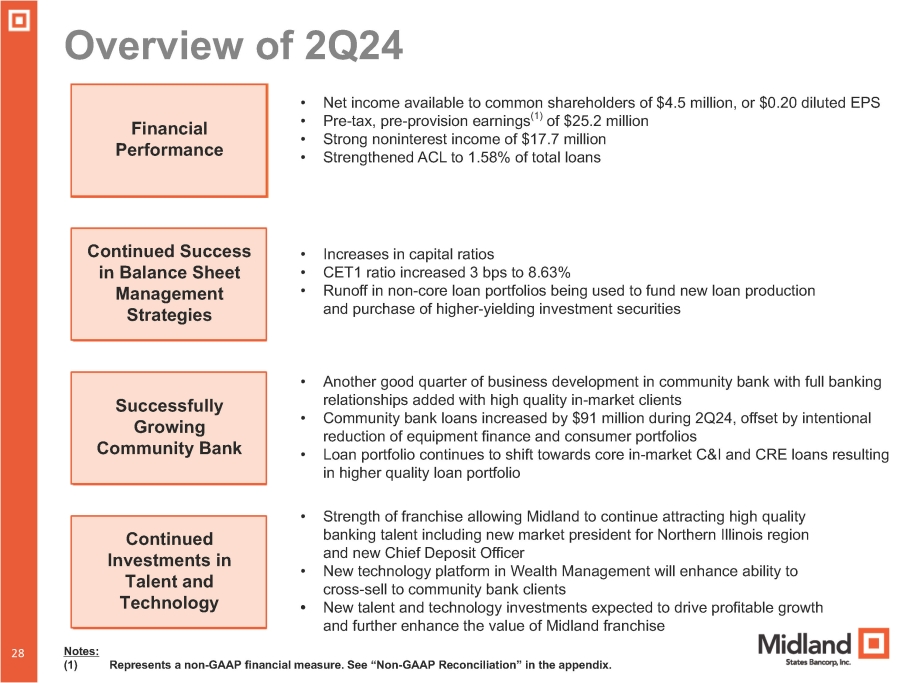
28 Overview of 2Q24 Financial Performance Continued Success in Balance Sheet Management Strategies Successfully Growing Community Bank Continued Investments in Talent and Technology 28 • Net income available to common shareholders of $4.5 million, or $0.20 diluted EPS • Pre - tax, pre - provision earnings (1) of $25.2 million • Strong noninterest income of $17.7 million • Strengthened ACL to 1.58% of total loans • Increases in capital ratios • CET1 ratio increased 3 bps to 8.63% • Runoff in non - core loan portfolios being used to fund new loan production and purchase of higher - yielding investment securities • Another good quarter of business development in community bank with full banking relationships added with high quality in - market clients • Community bank loans increased by $91 million during 2Q24, offset by intentional reduction of equipment finance and consumer portfolios • Loan portfolio continues to shift towards core in - market C&I and CRE loans resulting in higher quality loan portfolio • Strength of franchise allowing Midland to continue attracting high quality banking talent including new market president for Northern Illinois region and new Chief Deposit Officer • New technology platform in Wealth Management will enhance ability to cross - sell to community bank clients • New talent and technology investments expected to drive profitable growth and further enhance the value of Midland franchise Notes: (1) Represents a non - GAAP financial measure. See “Non - GAAP Reconciliation” in the appendix.
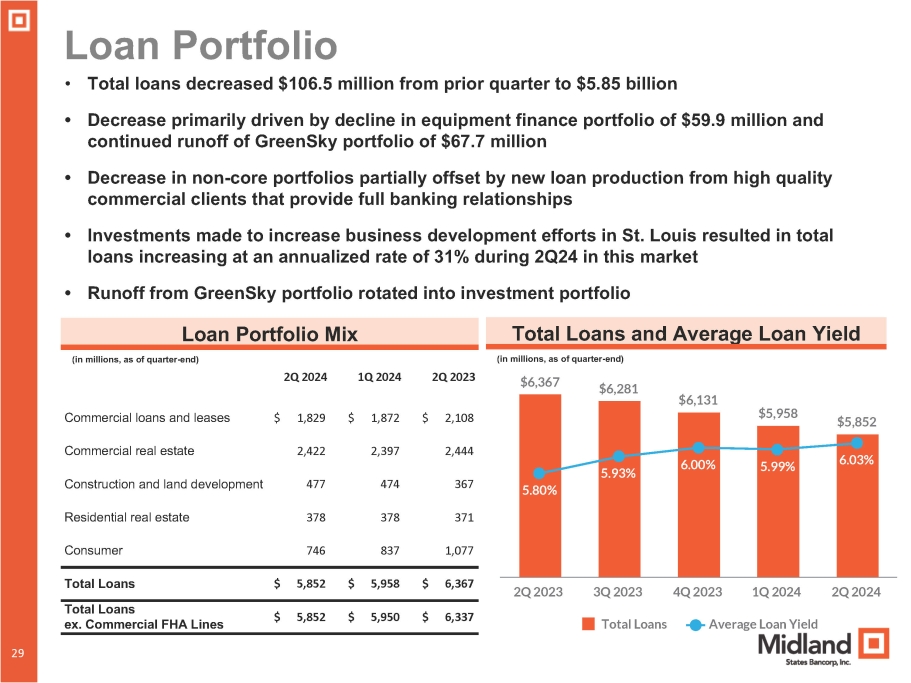
29 Loan Portfolio 29 • Total loans decreased $106.5 million from prior quarter to $5.85 billion • Decrease primarily driven by decline in equipment finance portfolio of $59.9 million and continued runoff of GreenSky portfolio of $67.7 million • Decrease in non - core portfolios partially offset by new loan production from high quality commercial clients that provide full banking relationships • Investments made to increase business development efforts in St. Louis resulted in total loans increasing at an annualized rate of 31% during 2Q24 in this market • Runoff from GreenSky portfolio rotated into investment portfolio Loan Portfolio Mix (in millions, as of quarter - end) 2Q 2024 1Q 2024 2Q 2023 Commercial loans and leases $ 1,829 $ 1,872 $ 2,108 Commercial real estate 2,422 2,397 2,444 Construction and land development 477 474 367 Residential real estate 378 378 371 Consumer 746 837 1,077 Total Loans $ 5,852 $ 5,958 $ 6,367 Total Loans ex. Commercial FHA Lines $ 5,852 $ 5,950 $ 6,337 $6,367 $6,281 $6,131 $5,958 $5,852 5.80% 5.93% 6.00% 5.99% 6.03% Total Loans 4Q 2023 1Q 2024 Average Loan Yield 2Q 2023 3Q 2023 2Q 2024 Total Loans and Average Loan Yield (in millions, as of quarter - end)
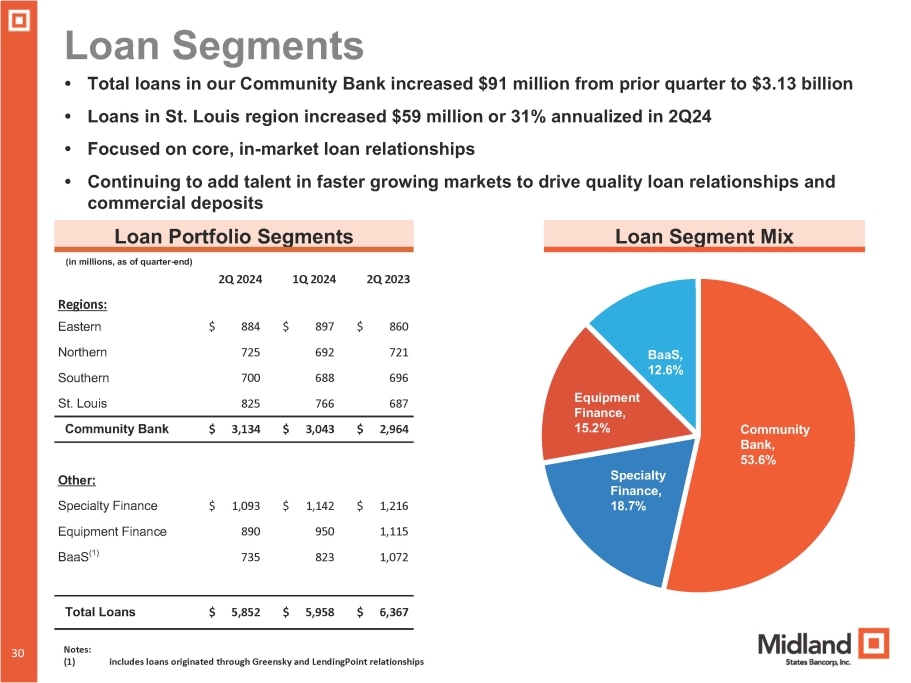
30 Loan Segments 30 (in millions, as of quarter - end) 2Q 2023 1Q 2024 2Q 2024 $ 860 $ 897 $ 884 Regions: Eastern 721 692 725 Northern 696 688 700 Southern 687 766 825 St. Louis 2,964 $ 3,043 $ 3,134 $ Community Bank Other: Specialty Finance Equipment Finance BaaS (1) $ 1,093 $ 1,142 $ 1,216 890 950 1,115 735 823 1,072 Total Loans $ 5,852 $ 5,958 $ 6,367 • Total loans in our Community Bank increased $91 million from prior quarter to $3.13 billion • Loans in St. Louis region increased $59 million or 31% annualized in 2Q24 • Focused on core, in - market loan relationships • Continuing to add talent in faster growing markets to drive quality loan relationships and commercial deposits Loan Portfolio Segments Loan Segment Mix Community Bank, 53.6% Specialty Finance, 18.7% Equipment Finance, 15.2% BaaS, 12.6% Notes: (1) includes loans originated through Greensky and LendingPoint relationships
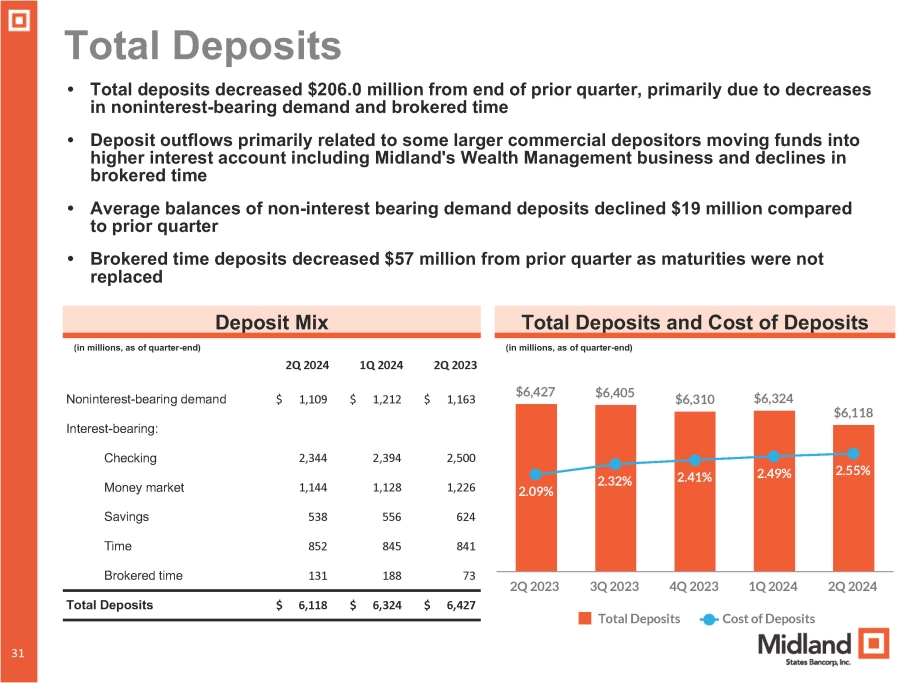
Total Deposits 2,500 2,394 2,344 Checking 1,226 1,128 1,144 Money market 624 556 538 Savings 841 845 852 Time 73 188 131 Brokered time $ 6,427 $ 6,324 Total Deposits $ 6,118 $6,427 $6,405 Noninterest - bearing demand $ 1,109 $ 1,212 $ 1,163 $6,310 $6,324 Interest - bearing: $6,118 2.09% 2.32% 2.41% 2.49% 2.55% 3Q 2023 4Q 2023 Total Deposits Cost of Deposits 2Q 2023 1Q 2024 2Q 2024 • Total deposits decreased $206.0 million from end of prior quarter, primarily due to decreases in noninterest - bearing demand and brokered time • Deposit outflows primarily related to some larger commercial depositors moving funds into higher interest account including Midland's Wealth Management business and declines in brokered time • Average balances of non - interest bearing demand deposits declined $19 million compared to prior quarter • Brokered time deposits decreased $57 million from prior quarter as maturities were not replaced Deposit Mix Total Deposits and Cost of Deposits (in millions, as of quarter - end) (in millions, as of quarter - end) 2Q 2024 1Q 2024 2Q 2023 31 31
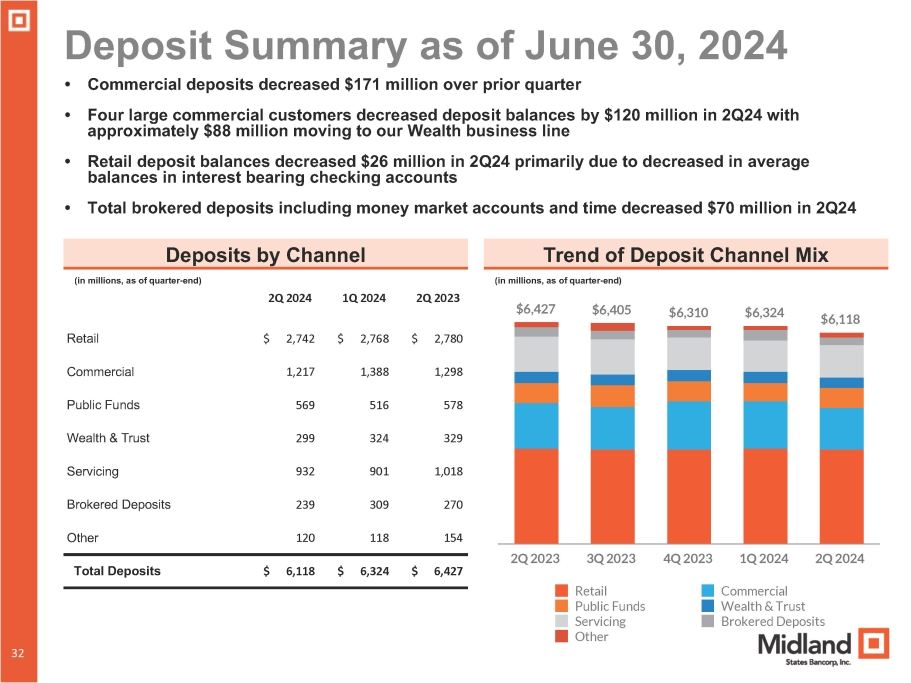
Deposit Summary as of June 30, 2024 $ 2,780 $ 2,768 $ 2,742 Retail 1,298 1,388 1,217 Commercial 578 516 569 Public Funds 329 324 299 Wealth & Trust 1,018 901 932 Servicing 270 309 239 Brokered Deposits 154 118 120 Other Total Deposits $ 6,118 $ 6,324 $ 6,427 $6,427 $6,405 $6,310 $6,324 $6,118 Retail Public Funds Servicing Other 1Q 2024 2Q 2024 Commercial Wealth & Trust Brokered Deposits 2Q 2023 3Q 2023 4Q 2023 • Commercial deposits decreased $171 million over prior quarter • Four large commercial customers decreased deposit balances by $120 million in 2Q24 with approximately $88 million moving to our Wealth business line • Retail deposit balances decreased $26 million in 2Q24 primarily due to decreased in average balances in interest bearing checking accounts • Total brokered deposits including money market accounts and time decreased $70 million in 2Q24 Deposits by Channel Trend of Deposit Channel Mix (in millions, as of quarter - end) (in millions, as of quarter - end) 2Q 2024 1Q 2024 2Q 2023 31 32
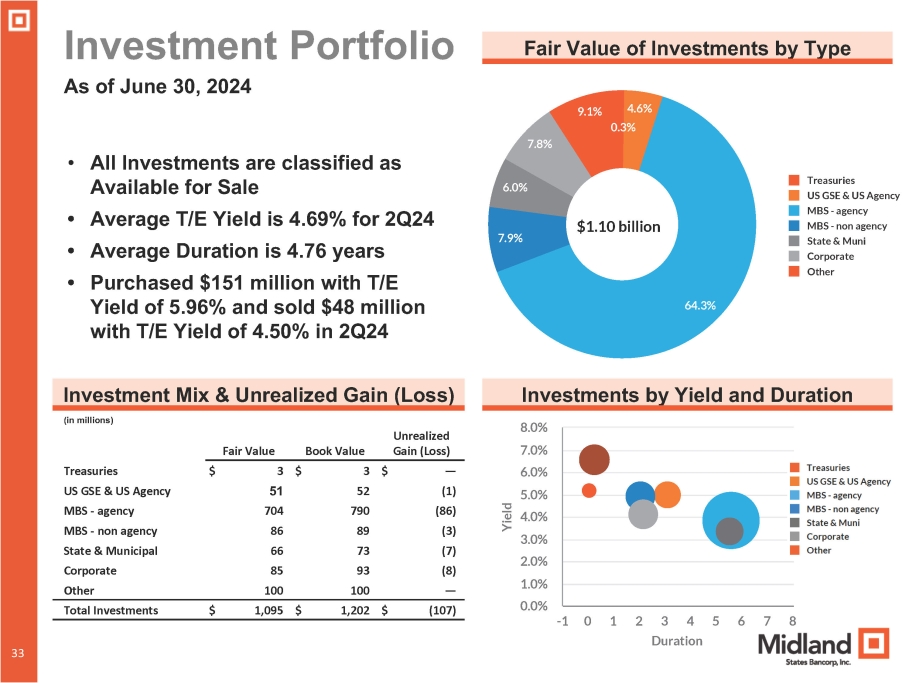
33 4.6% 64.3% 7.9% 6.0% 0.3% 7.8% 9.1% Treasuries US GSE & US Agency MBS - agency MBS - non agency State & Muni Corporate Other Investment Portfolio As of June 30, 2024 Fair Value of Investments by Type • All Investments are classified as Available for Sale • Average T/E Yield is 4.69% for 2Q24 • Average Duration is 4.76 years • Purchased $151 million with T/E Yield of 5.96% and sold $48 million with T/E Yield of 4.50% in 2Q24 Investments by Yield and Duration Investment Mix & Unrealized Gain (Loss) (in millions) Unrealized Gain (Loss) Book Value Fair Value $ — $ 3 $ 3 Treasuries (1) 52 51 US GSE & US Agency (86) 790 704 MBS - agency (3) 89 86 MBS - non agency (7) 73 66 State & Municipal (8) 93 85 Corporate — 100 100 Other $ (107) $ 1,202 $ 1,095 Total Investments - 1 0 1 2 3 4 5 6 7 8 Duration 33 Yiel d 8.0% 7.0% 6.0% 5.0% 4.0% 3.0% 2.0% 1.0% 0.0% $1.10 billion
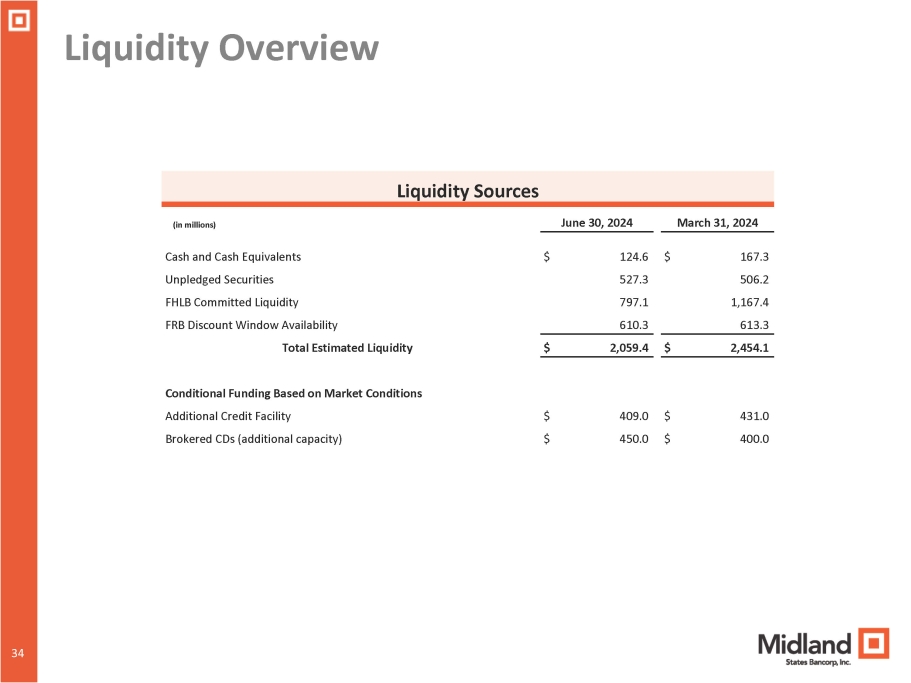
Liquidity Overview Liquidity Sources (in millions) June 30, 2024 March 31, 2024 $ 167.3 $ 124.6 Cash and Cash Equivalents 506.2 527.3 Unpledged Securities 1,167.4 797.1 FHLB Committed Liquidity 613.3 610.3 FRB Discount Window Availability $ 2,454.1 $ 2,059.4 Total Estimated Liquidity $ 431.0 $ 409.0 Conditional Funding Based on Market Conditions Additional Credit Facility $ 400.0 $ 450.0 Brokered CDs (additional capacity) 34 34
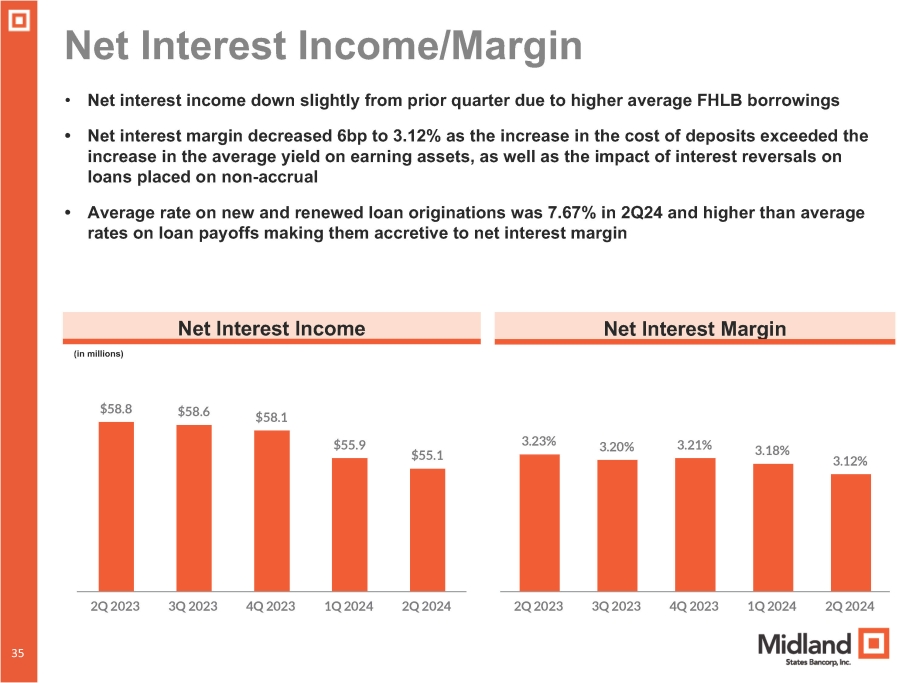
3.23% 3.20% 3.21% 3.18% 3.12% 2Q 2023 3Q 2023 4Q 2023 1Q 2024 2Q 2024 $58.8 $58.6 $58.1 $55.9 $55.1 2Q 2023 3Q 2023 4Q 2023 1Q 2024 2Q 2024 Net Interest Income/Margin • Net interest income down slightly from prior quarter due to higher average FHLB borrowings • Net interest margin decreased 6bp to 3.12% as the increase in the cost of deposits exceeded the increase in the average yield on earning assets, as well as the impact of interest reversals on loans placed on non - accrual • Average rate on new and renewed loan originations was 7.67% in 2Q24 and higher than average rates on loan payoffs making them accretive to net interest margin Net Interest Income (in millions) Net Interest Margin 34 35
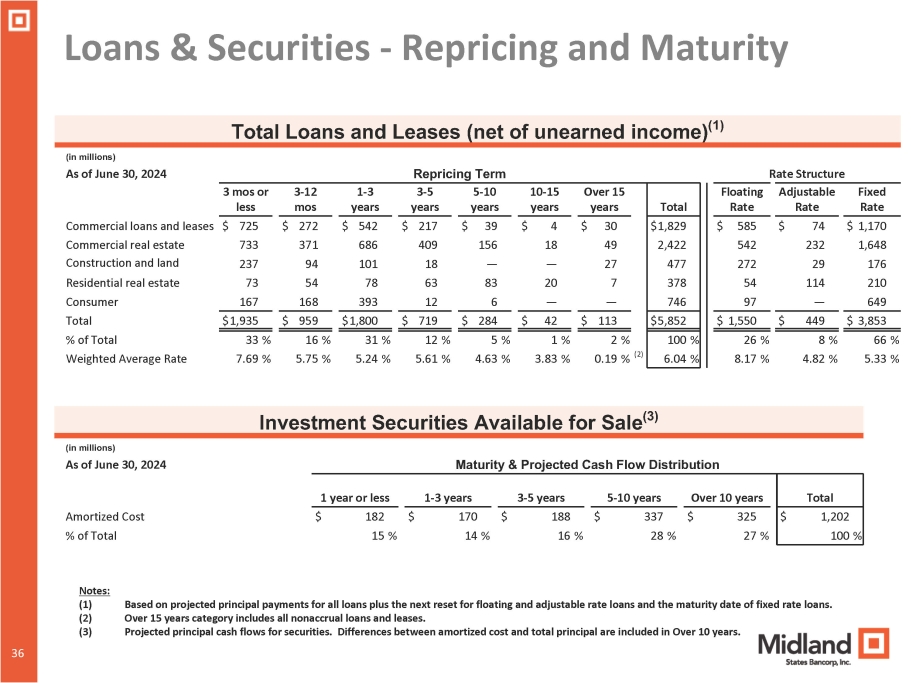
Loans & Securities - Repricing and Maturity Total Over 15 years 10 - 15 years 5 - 10 years 3 - 5 years 1 - 3 years 3 - 12 mos 3 mos or less $1,829 $ 30 $ 4 $ 39 $ 217 $ 542 $ 272 $ 725 2,422 49 18 156 409 686 371 733 477 27 — — 18 101 94 237 378 7 20 83 63 78 54 73 746 — — 6 12 393 168 167 $5,852 $ 959 $1,800 $ 719 $ 284 $ 42 $ 113 $1,935 100 % 2 % 1 % 5 % 12 % 31 % 16 % 33 % 6.04 % (2) 0.19 % 3.83 % 4.63 % 5.61 % 5.24 % 5.75 % 7.69 % Total Loans and Leases (net of unearned income) (1) (in millions) Rate Structure Repricing Term As of June 30, 2024 Fixed Rate Adjustable Rate Floating Rate $ 1,170 $ 74 $ 585 Commercial loans and leases 1,648 232 542 Commercial real estate 176 29 272 Construction and land 210 114 54 Residential real estate 649 — 97 Consumer $ 1,550 $ 449 $ 3,853 Total 66 % 8 % 26 % % of Total 5.33 % 4.82 % 8.17 % Weighted Average Rate Investment Securities Available for Sale (3) (in millions) Maturity & Projected Cash Flow Distribution As of June 30, 2024 Amortized Cost % of Total Total Over 10 years 5 - 10 years 3 - 5 years 1 - 3 years 1 year or less $ 1,202 $ 325 $ 337 $ 188 $ 170 $ 182 100 % 27 % 28 % 16 % 14 % 15 % 34 36 Notes: (1) (2) (3) Based on projected principal payments for all loans plus the next reset for floating and adjustable rate loans and the maturity date of fixed rate loans. Over 15 years category includes all nonaccrual loans and leases. Projected principal cash flows for securities. Differences between amortized cost and total principal are included in Over 10 years.
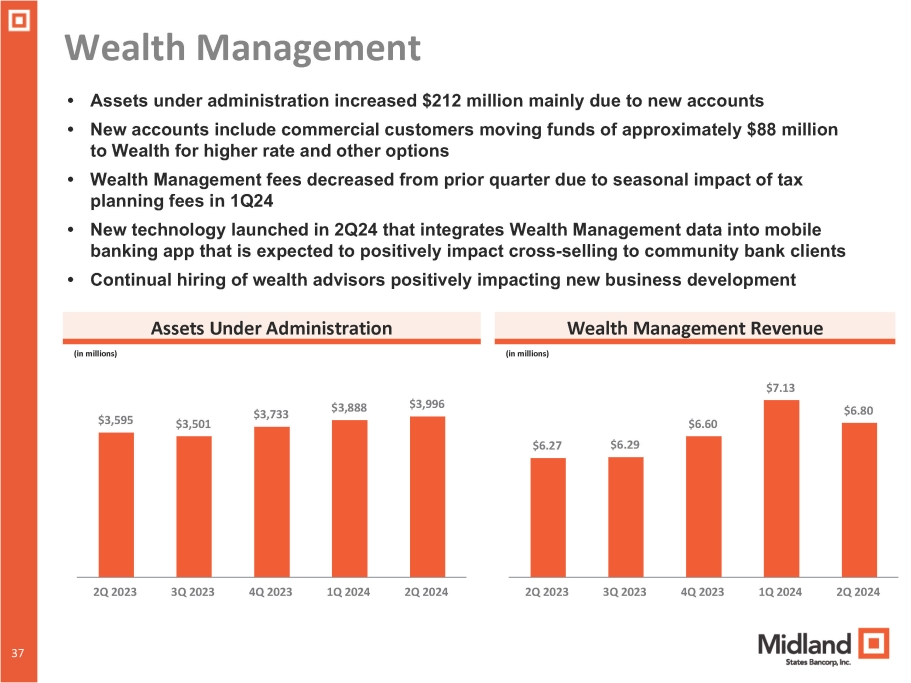
Wealth Management $3,595 $3,501 $3,733 $3,888 $3,996 • Assets under administration increased $212 million mainly due to new accounts • New accounts include commercial customers moving funds of approximately $88 million to Wealth for higher rate and other options • Wealth Management fees decreased from prior quarter due to seasonal impact of tax planning fees in 1Q24 • New technology launched in 2Q24 that integrates Wealth Management data into mobile banking app that is expected to positively impact cross - selling to community bank clients • Continual hiring of wealth advisors positively impacting new business development Assets Under Administration Wealth Management Revenue (in millions) (in millions) $7.13 2Q 2023 3Q 2023 4Q 2023 1Q 2024 2Q 2024 $6.27 34 37 $6.29 $6.60 $6.80 2Q 2023 3Q 2023 4Q 2023 1Q 2024 2Q 2024
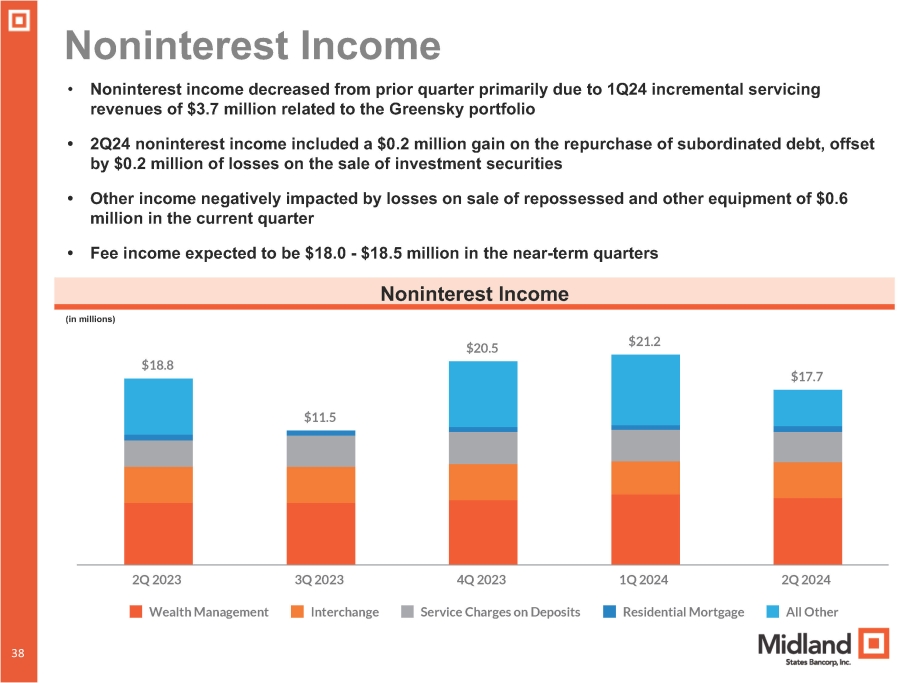
$18.8 $11.5 $20.5 $21.2 $17.7 Wealth Management Interchange Service Charges on Deposits Residential Mortgage All Other 2Q 2023 3Q 2023 4Q 2023 1Q 2024 2Q 2024 Noninterest Income • Noninterest income decreased from prior quarter primarily due to 1Q24 incremental servicing revenues of $3.7 million related to the Greensky portfolio • 2Q24 noninterest income included a $0.2 million gain on the repurchase of subordinated debt, offset by $0.2 million of losses on the sale of investment securities • Other income negatively impacted by losses on sale of repossessed and other equipment of $0.6 million in the current quarter • Fee income expected to be $18.0 - $18.5 million in the near - term quarters Noninterest Income (in millions) 34 38
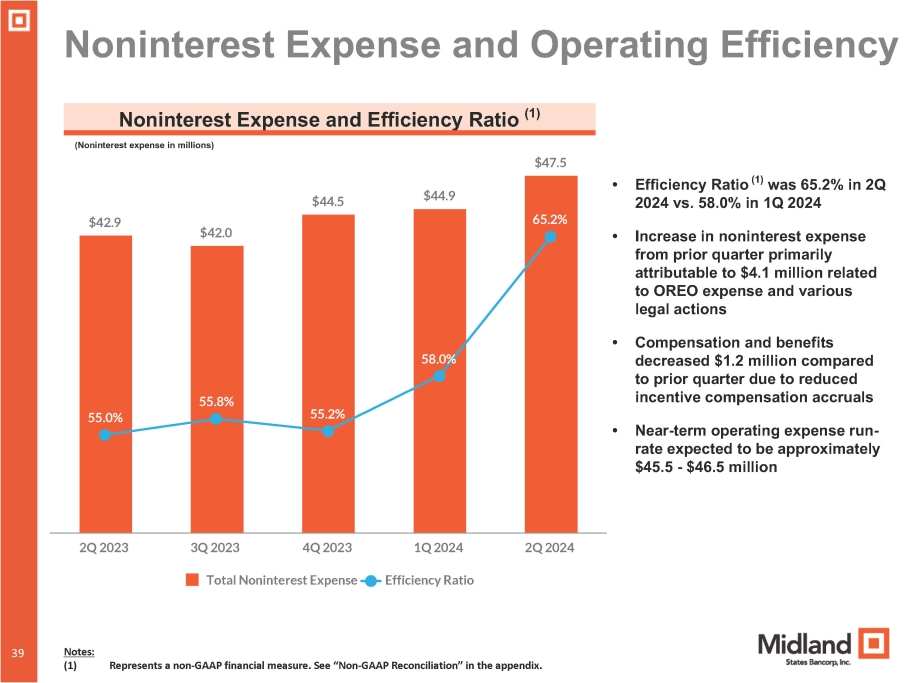
39 $42.9 $42.0 $44.5 $44.9 $47.5 55.0% 55.8% 55.2% 58.0% 65.2% 3Q 2023 4Q 2023 Total Noninterest Expense Efficiency Ratio 2Q 2023 1Q 2024 2Q 2024 Noninterest Expense and Operating Efficiency 39 Noninterest Expense and Efficiency Ratio (1) (Noninterest expense in millions) • Efficiency Ratio (1) was 65.2% in 2Q 2024 vs. 58.0% in 1Q 2024 • Increase in noninterest expense from prior quarter primarily attributable to $4.1 million related to OREO expense and various legal actions • Compensation and benefits decreased $1.2 million compared to prior quarter due to reduced incentive compensation accruals • Near - term operating expense run - rate expected to be approximately $45.5 - $46.5 million Notes: (1) Represents a non - GAAP financial measure. See “Non - GAAP Reconciliation” in the appendix.
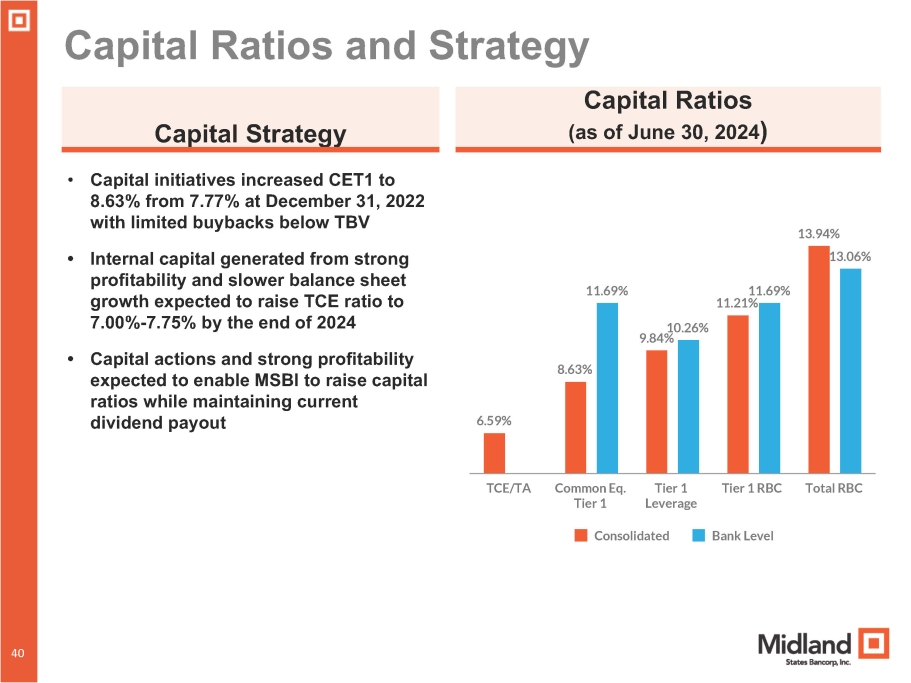
Capital Ratios and Strategy • Capital initiatives increased CET1 to 8.63% from 7.77% at December 31, 2022 with limited buybacks below TBV • Internal capital generated from strong profitability and slower balance sheet growth expected to raise TCE ratio to 7 . 00 % - 7 . 75 % by the end of 2024 • Capital actions and strong profitability expected to enable MSBI to raise capital ratios while maintaining current dividend payout Capital Strategy Capital Ratios (as of June 30, 2024 ) 6.59% 8.63% 9.84% 11.21% 13.94% 11.69% 10.26% 11.69% 13.06% Consolidated Bank Level TCE/TA 40 40 Common Eq. Tier 1 Tier 1 Leverage Tier 1 RBC Total RBC
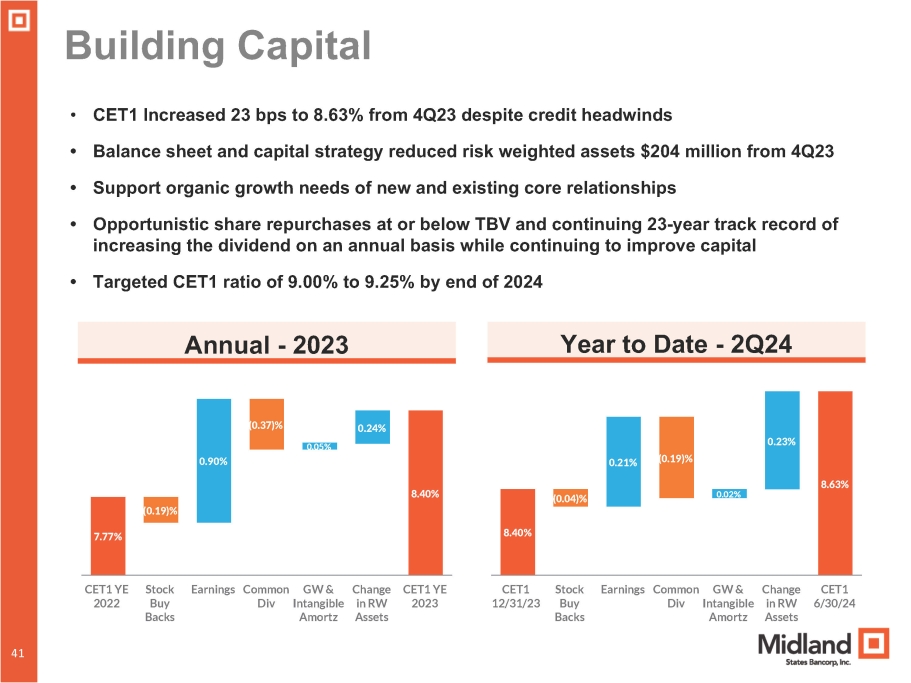
7.77% (0.19)% 0.90% (0.37) % 0.05% 0.24% 8.40% CET1 YE 2022 Stock Buy Backs Earnings Common GW & Change CET1 YE Div Intangible in RW 2023 Amortz Assets Building Capital Annual - 2023 Year to Date - 2Q24 8.40% 40 41 (0.04)% 0.21% (0.19)% 0.02% 0.23% 8.63% CET1 12/31/23 Stock Buy Backs Earnings Common GW & Change CET1 Div Intangible in RW 6/30/24 Amortz Assets • CET1 Increased 23 bps to 8.63% from 4Q23 despite credit headwinds • Balance sheet and capital strategy reduced risk weighted assets $204 million from 4Q23 • Support organic growth needs of new and existing core relationships • Opportunistic share repurchases at or below TBV and continuing 23 - year track record of increasing the dividend on an annual basis while continuing to improve capital • Targeted CET1 ratio of 9.00% to 9.25% by end of 2024

Outlook 40 42
2024 Outlook and Priorities 40 43 • Well positioned with increased levels of capital, liquidity, and reserves • Prudent risk management will remain top priority while economic uncertainty remains with business development efforts focused on adding new commercial and retail deposit relationships throughout our markets • Capitalizing on market disruption resulting from M&A to add new clients and banking talent • Strong financial performance and prudent balance sheet management should lead to further increases in capital ratios • Loan pipeline remains steady and new loan production within the community bank will continue to partially offset the runoff from the GreenSky portfolio and continued intentional reduction of the equipment finance portfolio • Neutral interest rate sensitivity positions Midland well for managing future changes in interest rates • Maintain disciplined expense management while also investing in areas that will enhance the long - term value of the franchise * Improvements in technology platform and additional advisors positively impacting business development in Wealth Management * Expanded presence in higher growth St. Louis market including the addition of a new market president resulting in new commercial, retail and wealth management clients * Banking - as - a - Service initiative expected to start making a contribution to deposit gathering and fee income during 2024
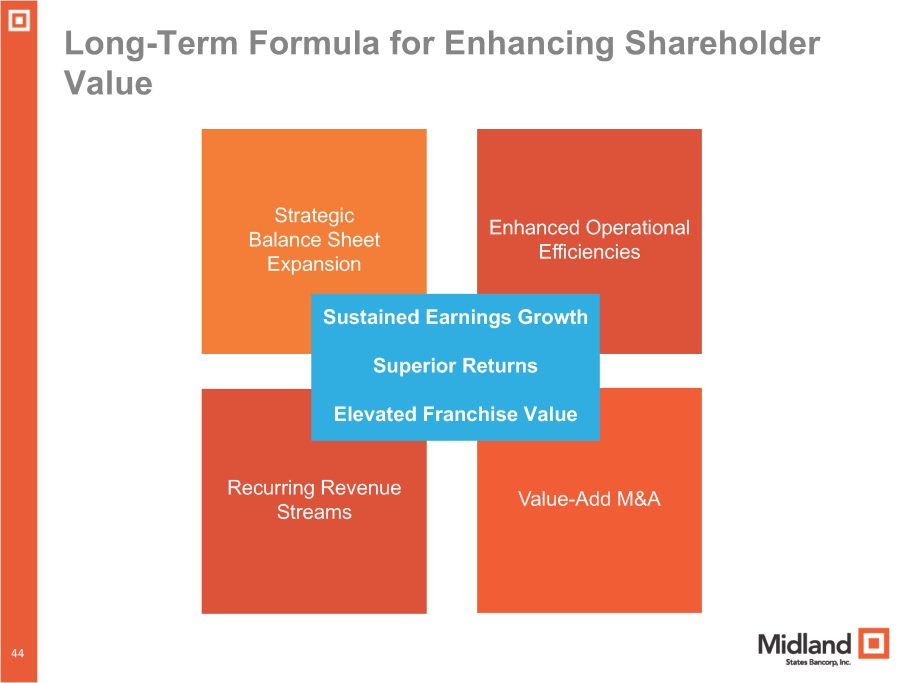
Long - Term Formula for Enhancing Shareholder Value Strategic Balance Sheet Expansion Enhanced Operational Efficiencies Recurring Revenue Streams Value - Add M&A Sustained Earni 40 44 ngs Growth Superior Returns Elevated Franchise Value

APPENDIX 40 45
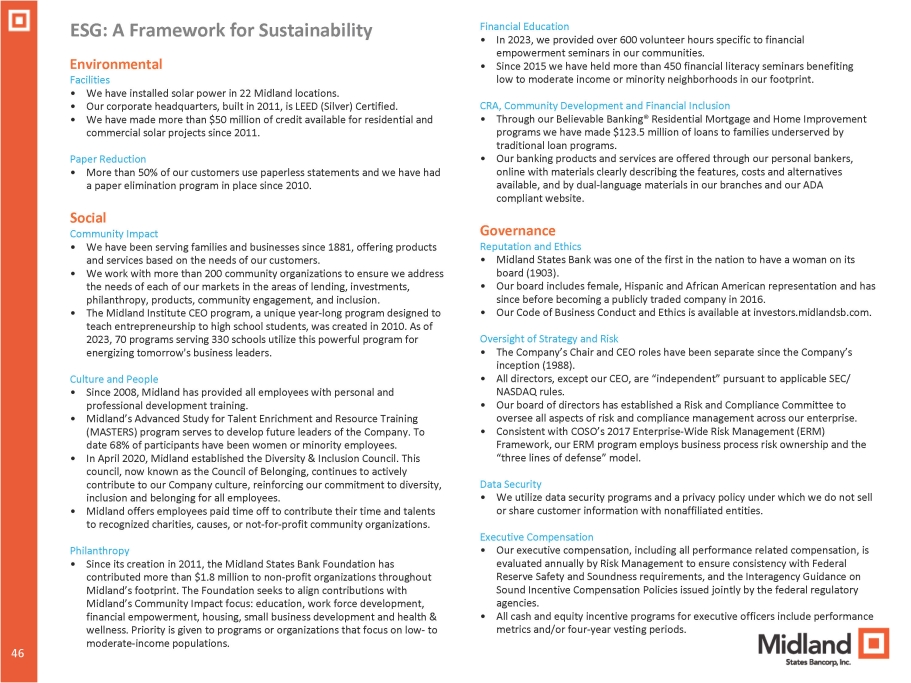
46 ESG: A Framework for Sustainability 46 Environmental Facilities • We have installed solar power in 22 Midland locations. • Our corporate headquarters, built in 2011, is LEED (Silver) Certified. • We have made more than $50 million of credit available for residential and commercial solar projects since 2011. Paper Reduction • More than 50% of our customers use paperless statements and we have had a paper elimination program in place since 2010. Social Community Impact • We have been serving families and businesses since 1881, offering products and services based on the needs of our customers. • We work with more than 200 community organizations to ensure we address the needs of each of our markets in the areas of lending, investments, philanthropy, products, community engagement, and inclusion. • The Midland Institute CEO program, a unique year - long program designed to teach entrepreneurship to high school students, was created in 2010. As of 2023, 70 programs serving 330 schools utilize this powerful program for energizing tomorrow's business leaders. Culture and People • Since 2008, Midland has provided all employees with personal and professional development training. • Midland’s Advanced Study for Talent Enrichment and Resource Training (MASTERS) program serves to develop future leaders of the Company. To date 68% of participants have been women or minority employees. • In April 2020, Midland established the Diversity & Inclusion Council. This council, now known as the Council of Belonging, continues to actively contribute to our Company culture, reinforcing our commitment to diversity, inclusion and belonging for all employees. • Midland offers employees paid time off to contribute their time and talents to recognized charities, causes, or not - for - profit community organizations. Philanthropy • Since its creation in 2011, the Midland States Bank Foundation has contributed more than $1.8 million to non - profit organizations throughout Midland’s footprint. The Foundation seeks to align contributions with Midland’s Community Impact focus: education, work force development, financial empowerment, housing, small business development and health & wellness. Priority is given to programs or organizations that focus on low - to moderate - income populations. Financial Education • In 2023, we provided over 600 volunteer hours specific to financial empowerment seminars in our communities. • Since 2015 we have held more than 450 financial literacy seminars benefiting low to moderate income or minority neighborhoods in our footprint. CRA, Community Development and Financial Inclusion • Through our Believable Banking® Residential Mortgage and Home Improvement programs we have made $123.5 million of loans to families underserved by traditional loan programs. • Our banking products and services are offered through our personal bankers, online with materials clearly describing the features, costs and alternatives available, and by dual - language materials in our branches and our ADA compliant website. Governance Reputation and Ethics • Midland States Bank was one of the first in the nation to have a woman on its board (1903). • Our board includes female, Hispanic and African American representation and has since before becoming a publicly traded company in 2016. • Our Code of Business Conduct and Ethics is available at investors.midlandsb.com. Oversight of Strategy and Risk • The Company’s Chair and CEO roles have been separate since the Company’s inception (1988). • All directors, except our CEO, are “independent” pursuant to applicable SEC/ NASDAQ rules. • Our board of directors has established a Risk and Compliance Committee to oversee all aspects of risk and compliance management across our enterprise. • Consistent with COSO’s 2017 Enterprise - Wide Risk Management (ERM) Framework, our ERM program employs business process risk ownership and the “three lines of defense” model. Data Security • We utilize data security programs and a privacy policy under which we do not sell or share customer information with nonaffiliated entities. Executive Compensation • Our executive compensation, including all performance related compensation, is evaluated annually by Risk Management to ensure consistency with Federal Reserve Safety and Soundness requirements, and the Interagency Guidance on Sound Incentive Compensation Policies issued jointly by the federal regulatory agencies. • All cash and equity incentive programs for executive officers include performance metrics and/or four - year vesting periods.
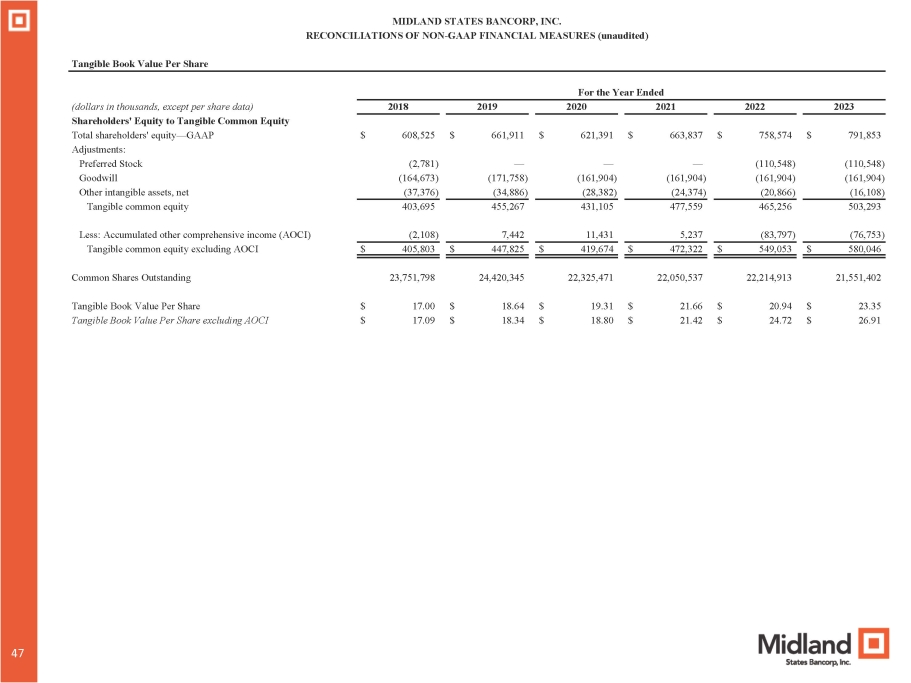
MIDLAND STATES BANCORP, INC. RECONCILIATIONS OF NON - GAAP FINANCIAL MEASURES (unaudited) Tangible Book Value Per Share For the Year Ended 2023 2022 2021 2020 2019 2018 (dollars in thousands, except per share data) $ 791,853 $ 758,574 $ 663,837 $ 621,391 $ 661,911 $ 608,525 Shareholders' Equity to Tangible Common Equity Total shareholders' equity — GAAP (110,548) (110,548) — — — (2,781) Adjustments: Preferred Stock (161,904) (161,904) (161,904) (161,904) (171,758) (164,673) Goodwill (16,108) (20,866) (24,374) (28,382) (34,886) (37,376) Other intangible assets, net 503,293 465,256 477,559 431,105 455,267 403,695 Tangible common equity (76,753) (83,797) 5,237 11,431 7,442 (2,108) Less: Accumulated other comprehensive income (AOCI) $ 580,046 $ 549,053 $ 472,322 $ 419,674 $ 447,825 $ 405,803 Tangible common equity excluding AOCI 21,551,402 22,214,913 22,050,537 22,325,471 24,420,345 23,751,798 Common Shares Outstanding $ 23.35 $ 20.94 $ 21.66 $ 19.31 $ 18.64 $ 17.00 Tangible Book Value Per Share $ 26.91 $ 24.72 $ 21.42 $ 18.80 $ 18.34 $ 17.09 Tangible Book Value Per Share excluding AOCI 47 47
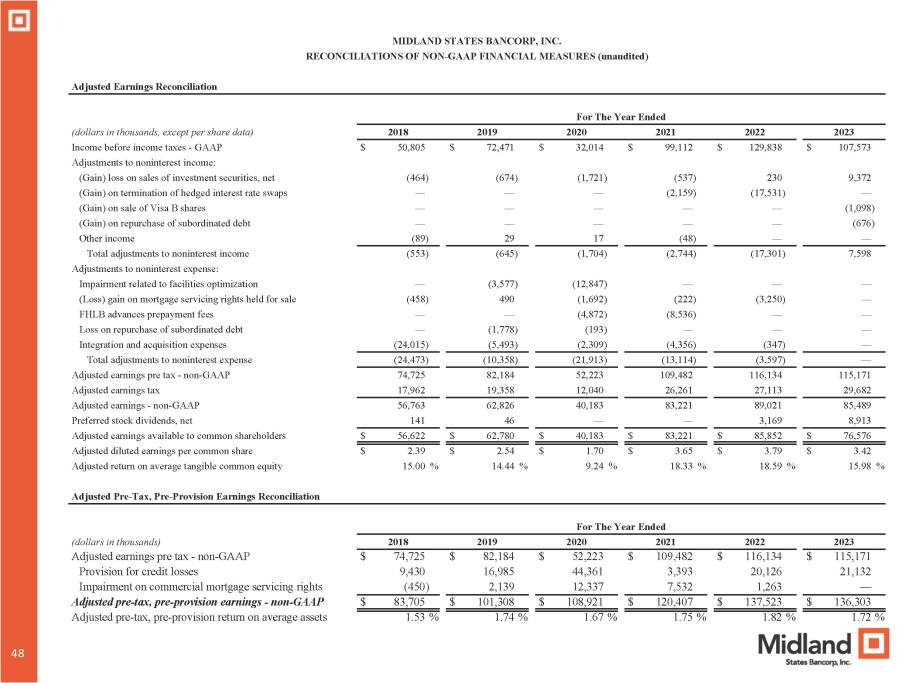
MIDLAND STATES BANCORP, INC. RECONCILIATIONS OF NON - GAAP FINANCIAL MEASURES (unaudited) Adjusted Earnings Reconciliation For The Year Ended 2023 2022 2021 2020 2019 2018 (dollars in thousands, except per share data) $ 107,573 $ 129,838 $ 99,112 $ 32,014 $ 72,471 $ 50,805 Income before income taxes - GAAP Adjustments to noninterest income: 9,372 230 (537) (1,721) (674) (464) (Gain) loss on sales of investment securities, net — (17,531) (2,159) — — — (Gain) on termination of hedged interest rate swaps (1,098) — — — — — (Gain) on sale of Visa B shares (676) — — — — — (Gain) on repurchase of subordinated debt — — (48) 17 29 (89) Other income 7,598 (17,301) (2,744) (1,704) (645) (553) Total adjustments to noninterest income Adjustments to noninterest expense: — — — (12,847) (3,577) — Impairment related to facilities optimization — (3,250) (222) (1,692) 490 (458) (Loss) gain on mortgage servicing rights held for sale — — (8,536) (4,872) — — FHLB advances prepayment fees — — — (193) (1,778) — Loss on repurchase of subordinated debt — (347) (4,356) (2,309) (5,493) (24,015) Integration and acquisition expenses — (3,597) (13,114) (21,913) (10,358) (24,473) Total adjustments to noninterest expense 115,171 116,134 109,482 52,223 82,184 74,725 Adjusted earnings pre tax - non - GAAP 29,682 27,113 26,261 12,040 19,358 17,962 Adjusted earnings tax 85,489 89,021 83,221 40,183 62,826 56,763 Adjusted earnings - non - GAAP 8,913 3,169 — — 46 141 Preferred stock dividends, net $ 76,576 $ 85,852 $ 83,221 $ 40,183 $ 62,780 $ 56,622 Adjusted earnings available to common shareholders $ 3.42 $ 3.79 $ 3.65 $ 1.70 $ 2.54 $ 2.39 Adjusted diluted earnings per common share 15.98 % 18.59 % 18.33 % 9.24 % 14.44 % 15.00 % Adjusted return on average tangible common equity Adjusted Pre - Tax, Pre - Provision Earnings Reconciliation For The Year Ended 2023 2022 2021 2020 2019 2018 (dollars in thousands) $ 115,171 $ 116,134 $ 109,482 $ 52,223 $ 82,184 $ 74,725 Adjusted earnings pre tax - non - GAAP 21,132 20,126 3,393 44,361 16,985 9,430 Provision for credit losses — 1,263 7,532 12,337 2,139 (450) Impairment on commercial mortgage servicing rights $ 136,303 $ 137,523 $ 120,407 $ 108,921 $ 101,308 $ 83,705 Adjusted pre - tax, pre - provision earnings - non - GAAP 1.72 % 1.82 % 1.75 % 1.67 % 1.74 % 1.53 % Adjusted pre - tax, pre - provision return on average assets 47 48
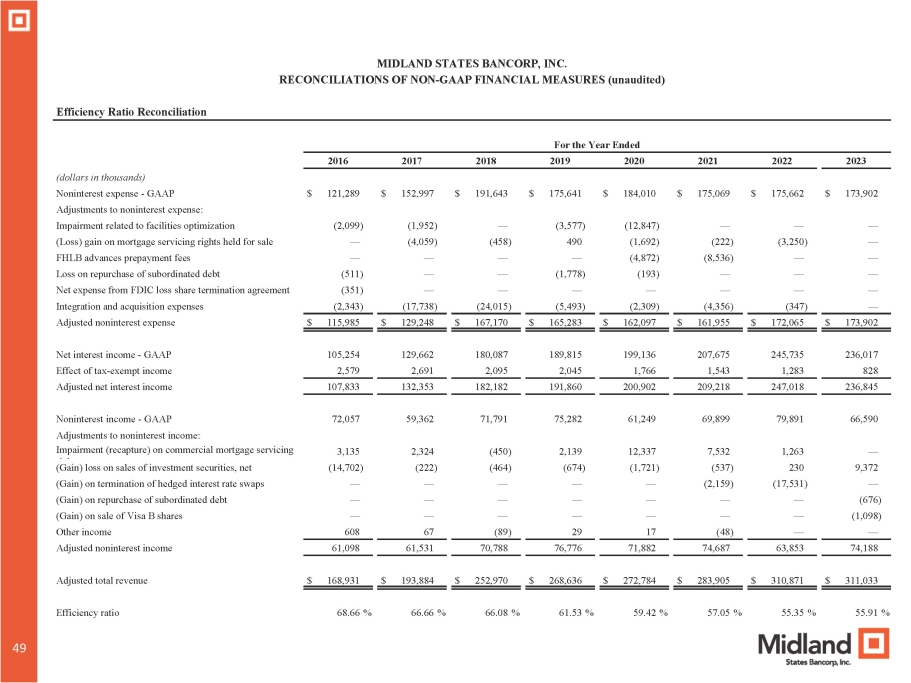
MIDLAND STATES BANCORP, INC. RECONCILIATIONS OF NON - GAAP FINANCIAL MEASURES (unaudited) Efficiency Ratio Reconciliation For the Year Ended 2023 2022 2021 2020 2019 2018 2017 2016 (dollars in thousands) $ 173,902 $ 175,662 $ 175,069 $ 184,010 $ 175,641 $ 191,643 $ 152,997 $ 121,289 Noninterest expense - GAAP Adjustments to noninterest expense: — — — (12,847) (3,577) — (1,952) (2,099) Impairment related to facilities optimization — (3,250) (222) (1,692) 490 (458) (4,059) — (Loss) gain on mortgage servicing rights held for sale — — (8,536) (4,872) — — — — FHLB advances prepayment fees — — — (193) (1,778) — — (511) Loss on repurchase of subordinated debt — — — — — — — (351) Net expense from FDIC loss share termination agreement — (347) (4,356) (2,309) (5,493) (24,015) (17,738) (2,343) Integration and acquisition expenses Adjusted noninterest expense $ 115,985 $ 129,248 $ 167,170 $ 165,283 $ 162,097 $ 161,955 $ 172,065 $ 173,902 236,017 245,735 207,675 199,136 189,815 180,087 129,662 105,254 Net interest income - GAAP 828 1,283 1,543 1,766 2,045 2,095 2,691 2,579 Effect of tax - exempt income 236,845 247,018 209,218 200,902 191,860 182,182 132,353 107,833 Adjusted net interest income 66,590 79,891 69,899 61,249 75,282 71,791 59,362 72,057 Noninterest income - GAAP — 1,263 7,532 12,337 2,139 (450) 2,324 3,135 Adjustments to noninterest income: Impairment (recapture) on commercial mortgage servicing 9,372 230 (537) (1,721) (674) (464) (222) (14,702) (Gain) loss on sales of investment securities, net — (17,531) (2,159) — — — — — (Gain) on termination of hedged interest rate swaps (676) — — — — — — — (Gain) on repurchase of subordinated debt (1,098) — — — — — — — (Gain) on sale of Visa B shares — — (48) 17 29 (89) 67 608 Other income 74,188 63,853 74,687 71,882 76,776 70,788 61,531 61,098 Adjusted noninterest income $ 311,033 $ 310,871 $ 283,905 $ 272,784 $ 268,636 $ 252,970 $ 193,884 $ 168,931 Adjusted total revenue 55.91 % 55.35 % 57.05 % 59.42 % 61.53 % 66.08 % 66.66 % 68.66 % Efficiency ratio 49
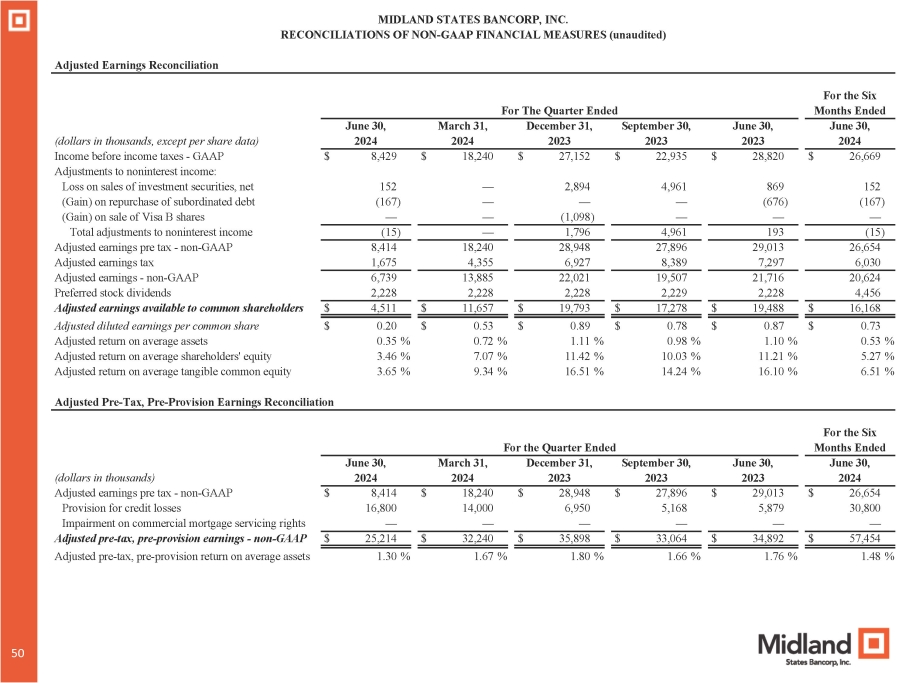
MIDLAND STATES BANCORP, INC. RECONCILIATIONS OF NON - GAAP FINANCIAL MEASURES (unaudited) Adjusted Earnings Reconciliation For the Six Months Ended For The Quarter Ended June 30, 2024 June 30, 2023 June 30, March 31, December 31, September 30, (dollars in thousands, except per share data) 2024 2024 2023 2023 $ 26,669 152 $ 28,820 869 Income before income taxes - GAAP $ 8,429 $ 18,240 $ 27,152 $ 22,935 Adjustments to noninterest income: Loss on sales of investment securities, net 152 — 2,894 4,961 (167) — (676) — (Gain) on repurchase of subordinated debt (167) — — — (Gain) on sale of Visa B shares — — (1,098) — (15) 193 Total adjustments to noninterest income (15) — 1,796 4,961 26,654 29,013 Adjusted earnings pre tax - non - GAAP 8,414 18,240 28,948 27,896 6,030 7,297 Adjusted earnings tax 1,675 4,355 6,927 8,389 20,624 21,716 Adjusted earnings - non - GAAP 6,739 13,885 22,021 19,507 4,456 2,228 Preferred stock dividends 2,228 2,228 2,228 2,229 $ 16,168 $ 19,488 Adjusted earnings available to common shareholders $ 4,511 $ 11,657 $ 19,793 $ 17,278 $ 0.73 $ 0.87 Adjusted diluted earnings per common share $ 0.20 $ 0.53 $ 0.89 $ 0.78 0.53 % 1.10 % Adjusted return on average assets 0.35 % 0.72 % 1.11 % 0.98 % 5.27 % 11.21 % Adjusted return on average shareholders' equity 3.46 % 7.07 % 11.42 % 10.03 % 6.51 % 16.10 % Adjusted return on average tangible common equity 3.65 % 9.34 % 16.51 % 14.24 % Adjusted Pre - Tax, Pre - Provision Earnings Reconciliation For the Six Months Ended For the Quarter Ended June 30, 2024 June 30, 2023 June 30, March 31, December 31, September 30, (dollars in thousands) 2024 2024 2023 2023 $ 26,654 $ 29,013 $ 27,896 $ 28,948 $ 18,240 $ 8,414 Adjusted earnings pre tax - non - GAAP 30,800 5,879 5,168 6,950 14,000 16,800 Provision for credit losses — — — — — — Impairment on commercial mortgage servicing rights $ 57,454 $ 34,892 $ 33,064 $ 35,898 $ 32,240 $ 25,214 Adjusted pre - tax, pre - provision earnings - non - GAAP 1.48 % 1.76 % 1.66 % 1.80 % 1.67 % 1.30 % Adjusted pre - tax, pre - provision return on average assets 50 50
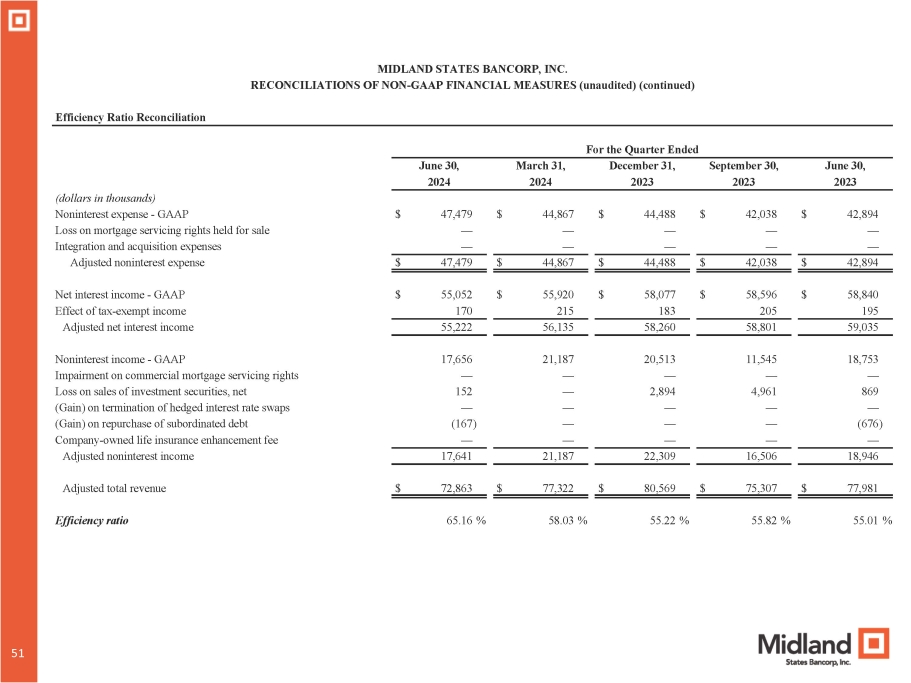
MIDLAND STATES BANCORP, INC. RECONCILIATIONS OF NON - GAAP FINANCIAL MEASURES (unaudited) (continued) Efficiency Ratio Reconciliation For the Quarter Ended June 30, September 30, December 31, March 31, June 30, 2023 2023 2023 2024 2024 $ 42,894 $ 42,038 $ 44,488 $ 44,867 $ 47,479 (dollars in thousands) Noninterest expense - GAAP — — — — — Loss on mortgage servicing rights held for sale — — — — — Integration and acquisition expenses $ 42,894 $ 42,038 $ 44,488 $ 44,867 $ 47,479 Adjusted noninterest expense $ 58,840 $ 58,596 $ 58,077 $ 55,920 $ 55,052 Net interest income - GAAP 195 205 183 215 170 Effect of tax - exempt income 59,035 58,801 58,260 56,135 55,222 Adjusted net interest income 18,753 11,545 20,513 21,187 17,656 Noninterest income - GAAP — — — — — Impairment on commercial mortgage servicing rights 869 4,961 2,894 — 152 Loss on sales of investment securities, net — — — — — (Gain) on termination of hedged interest rate swaps (676) — — — (167) (Gain) on repurchase of subordinated debt — — — — — Company - owned life insurance enhancement fee 18,946 16,506 22,309 21,187 17,641 Adjusted noninterest income $ 77,981 $ 75,307 $ 80,569 $ 77,322 $ 72,863 Adjusted total revenue 55.01 % 55.82 % 55.22 % 58.03 % 65.16 % Efficiency ratio 50 51
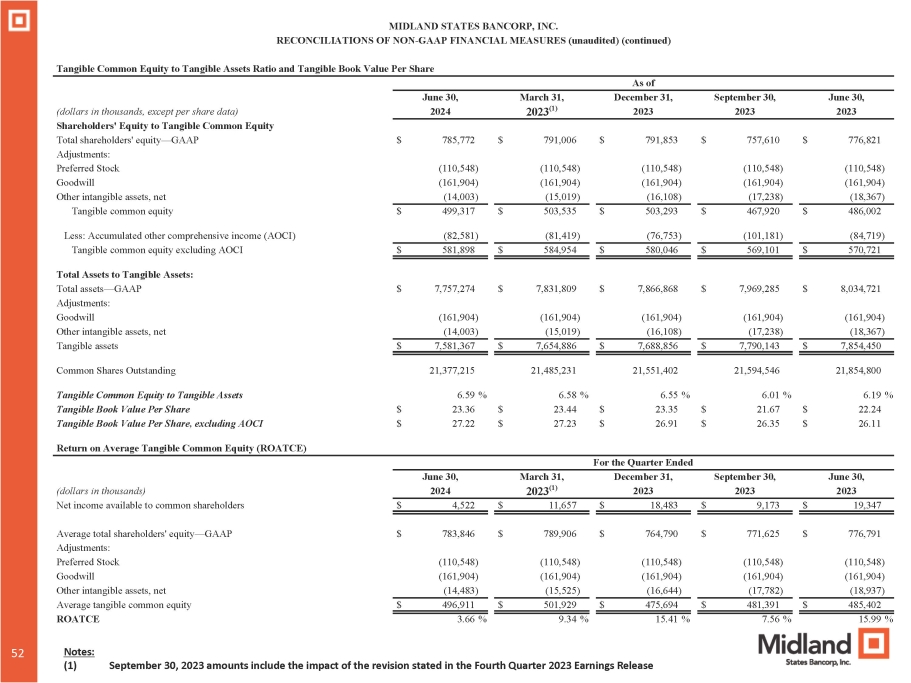
52 Per Share Tangible Common Equity to Tangible Assets Ratio and Tangible Book Value As of June 30, September 30, December 31, March 31, June 30, 2023 2023 2023 2023 (1) 2024 (dollars in thousands, except per share data) Shareholders' Equity to Tangible Common Equity $ 776,821 $ 757,610 $ 791,853 $ 791,006 $ 785,772 Total shareholders' equity
— GAAP Adjustments: (110,548) (110,548) (110,548) (110,548) (110,548) Preferred Stock (161,904) (161,904) (161,904) (161,904) (161,904) Goodwill (18,367) (17,238) (16,108) (15,019) (14,003) Other intangible assets, net $ 486,002 $ 467,920 $ 503,293 $ 503,535 $ 499,317 Tangible common equity (84,719) (101,181) (76,753) (81,419) (82,581) Less: Accumulated other comprehensive income (AOCI) $ 570,721 $ 569,101 $ 580,046 $ 584,954 $ 581,898 Tangible common equity excluding AOCI Total Assets to Tangible Assets: $ 8,034,721 $ 7,969,285 $ 7,866,868 $ 7,831,809 $ 7,757,274 Total assets — GAAP Adjustments: (161,904) (161,904) (161,904) (161,904) (161,904) Goodwill (18,367) (17,238) (16,108) (15,019) (14,003) Other intangible assets, net $ 7,854,450 $ 7,790,143 $ 7,688,856 $ 7,654,886 $ 7,581,367 Tangible assets 21,854,800 21,594,546 21,551,402 21,485,231 21,377,215 Common Shares Outstanding 6.19 % 6.01 % 6.55 % 6.58 % 6.59 % Tangible Common Equity to Tangible Assets $ 22.24 $ 21.67 $ 23.35 $ 23.44 $ 23.36 Tangible Book Value Per Share $ 26.11 $ 26.35 $ 26.91 $ 27.23 $ 27.22 Tangible Book Value Per Share, excluding AOCI Return on Average Tangible Common Equity (ROATCE) For the Quarter Ended June 30, September 30, December 31, March 31, June 30, 2023 2023 2023 2023 (1) 2024 (dollars in thousands) $ 19,347 $ 9,173 $ 18,483 $ 11,657 $ 4,522 Net income available to common shareholders $ 776,791 $ 771,625 $ 764,790 $ 789,906 $ 783,846 Average total shareholders' equity — GAAP Adjustments: (110,548) (110,548) (110,548) (110,548) (110,548) Preferred Stock (161,904) (161,904) (161,904) (161,904) (161,904) Goodwill (18,937) (17,782) (16,644) (15,525) (14,483) Other intangible assets, net $ 485,402 $ 481,391 $ 475,694 $ 501,929 $ 496,911 Average tangible common equity 15.99 % 7.56 % 15.41 % 9.34 % 3.66 % ROATCE MIDLAND STATES BANCORP, INC. RECONCILIATIONS OF NON - GAAP FINANCIAL MEASURES (unaudited) (continued) (1) September 30, 2023 amounts include the impact of the revision stated in the Fourth Quarter 2023 Earnings Release
v3.24.2
Cover
|
Jul. 29, 2024 |
| Document Type |
8-K
|
| Amendment Flag |
false
|
| Document Period End Date |
Jul. 29, 2024
|
| Entity File Number |
001-35272
|
| Entity Registrant Name |
Midland States Bancorp, Inc.
|
| Entity Central Index Key |
0001466026
|
| Entity Tax Identification Number |
37-1233196
|
| Entity Incorporation, State or Country Code |
IL
|
| Entity Address, Address Line One |
1201 Network Centre Drive
|
| Entity Address, City or Town |
Effingham
|
| Entity Address, State or Province |
IL
|
| Entity Address, Postal Zip Code |
62401
|
| City Area Code |
(217)
|
| Local Phone Number |
342-7321
|
| Written Communications |
false
|
| Soliciting Material |
false
|
| Pre-commencement Tender Offer |
false
|
| Pre-commencement Issuer Tender Offer |
false
|
| Entity Emerging Growth Company |
false
|
| Common stock, $0.01 par value |
|
| Title of 12(b) Security |
Common stock, $0.01 par value
|
| Trading Symbol |
MSBI
|
| Security Exchange Name |
NASDAQ
|
| Depositary Shares (each representing a 1/40th interest in a share of 7.750% Fixed-Rate Reset Non-Cumulative Perpetual Preferred Stock, Series A, $2.00 par value) |
|
| Title of 12(b) Security |
Depositary Shares
|
| Trading Symbol |
MSBIP
|
| Security Exchange Name |
NASDAQ
|
| X |
- DefinitionBoolean flag that is true when the XBRL content amends previously-filed or accepted submission.
| Name: |
dei_AmendmentFlag |
| Namespace Prefix: |
dei_ |
| Data Type: |
xbrli:booleanItemType |
| Balance Type: |
na |
| Period Type: |
duration |
|
| X |
- DefinitionFor the EDGAR submission types of Form 8-K: the date of the report, the date of the earliest event reported; for the EDGAR submission types of Form N-1A: the filing date; for all other submission types: the end of the reporting or transition period. The format of the date is YYYY-MM-DD.
| Name: |
dei_DocumentPeriodEndDate |
| Namespace Prefix: |
dei_ |
| Data Type: |
xbrli:dateItemType |
| Balance Type: |
na |
| Period Type: |
duration |
|
| X |
- DefinitionThe type of document being provided (such as 10-K, 10-Q, 485BPOS, etc). The document type is limited to the same value as the supporting SEC submission type, or the word 'Other'.
| Name: |
dei_DocumentType |
| Namespace Prefix: |
dei_ |
| Data Type: |
dei:submissionTypeItemType |
| Balance Type: |
na |
| Period Type: |
duration |
|
| X |
- DefinitionAddress Line 1 such as Attn, Building Name, Street Name
| Name: |
dei_EntityAddressAddressLine1 |
| Namespace Prefix: |
dei_ |
| Data Type: |
xbrli:normalizedStringItemType |
| Balance Type: |
na |
| Period Type: |
duration |
|
| X |
- Definition
+ References
+ Details
| Name: |
dei_EntityAddressCityOrTown |
| Namespace Prefix: |
dei_ |
| Data Type: |
xbrli:normalizedStringItemType |
| Balance Type: |
na |
| Period Type: |
duration |
|
| X |
- DefinitionCode for the postal or zip code
| Name: |
dei_EntityAddressPostalZipCode |
| Namespace Prefix: |
dei_ |
| Data Type: |
xbrli:normalizedStringItemType |
| Balance Type: |
na |
| Period Type: |
duration |
|
| X |
- DefinitionName of the state or province.
| Name: |
dei_EntityAddressStateOrProvince |
| Namespace Prefix: |
dei_ |
| Data Type: |
dei:stateOrProvinceItemType |
| Balance Type: |
na |
| Period Type: |
duration |
|
| X |
- DefinitionA unique 10-digit SEC-issued value to identify entities that have filed disclosures with the SEC. It is commonly abbreviated as CIK. Reference 1: http://www.xbrl.org/2003/role/presentationRef
-Publisher SEC
-Name Exchange Act
-Number 240
-Section 12
-Subsection b-2
| Name: |
dei_EntityCentralIndexKey |
| Namespace Prefix: |
dei_ |
| Data Type: |
dei:centralIndexKeyItemType |
| Balance Type: |
na |
| Period Type: |
duration |
|
| X |
- DefinitionIndicate if registrant meets the emerging growth company criteria. Reference 1: http://www.xbrl.org/2003/role/presentationRef
-Publisher SEC
-Name Exchange Act
-Number 240
-Section 12
-Subsection b-2
| Name: |
dei_EntityEmergingGrowthCompany |
| Namespace Prefix: |
dei_ |
| Data Type: |
xbrli:booleanItemType |
| Balance Type: |
na |
| Period Type: |
duration |
|
| X |
- DefinitionCommission file number. The field allows up to 17 characters. The prefix may contain 1-3 digits, the sequence number may contain 1-8 digits, the optional suffix may contain 1-4 characters, and the fields are separated with a hyphen.
| Name: |
dei_EntityFileNumber |
| Namespace Prefix: |
dei_ |
| Data Type: |
dei:fileNumberItemType |
| Balance Type: |
na |
| Period Type: |
duration |
|
| X |
- DefinitionTwo-character EDGAR code representing the state or country of incorporation.
| Name: |
dei_EntityIncorporationStateCountryCode |
| Namespace Prefix: |
dei_ |
| Data Type: |
dei:edgarStateCountryItemType |
| Balance Type: |
na |
| Period Type: |
duration |
|
| X |
- DefinitionThe exact name of the entity filing the report as specified in its charter, which is required by forms filed with the SEC. Reference 1: http://www.xbrl.org/2003/role/presentationRef
-Publisher SEC
-Name Exchange Act
-Number 240
-Section 12
-Subsection b-2
| Name: |
dei_EntityRegistrantName |
| Namespace Prefix: |
dei_ |
| Data Type: |
xbrli:normalizedStringItemType |
| Balance Type: |
na |
| Period Type: |
duration |
|
| X |
- DefinitionThe Tax Identification Number (TIN), also known as an Employer Identification Number (EIN), is a unique 9-digit value assigned by the IRS. Reference 1: http://www.xbrl.org/2003/role/presentationRef
-Publisher SEC
-Name Exchange Act
-Number 240
-Section 12
-Subsection b-2
| Name: |
dei_EntityTaxIdentificationNumber |
| Namespace Prefix: |
dei_ |
| Data Type: |
dei:employerIdItemType |
| Balance Type: |
na |
| Period Type: |
duration |
|
| X |
- DefinitionLocal phone number for entity.
| Name: |
dei_LocalPhoneNumber |
| Namespace Prefix: |
dei_ |
| Data Type: |
xbrli:normalizedStringItemType |
| Balance Type: |
na |
| Period Type: |
duration |
|
| X |
- DefinitionBoolean flag that is true when the Form 8-K filing is intended to satisfy the filing obligation of the registrant as pre-commencement communications pursuant to Rule 13e-4(c) under the Exchange Act. Reference 1: http://www.xbrl.org/2003/role/presentationRef
-Publisher SEC
-Name Exchange Act
-Number 240
-Section 13e
-Subsection 4c
| Name: |
dei_PreCommencementIssuerTenderOffer |
| Namespace Prefix: |
dei_ |
| Data Type: |
xbrli:booleanItemType |
| Balance Type: |
na |
| Period Type: |
duration |
|
| X |
- DefinitionBoolean flag that is true when the Form 8-K filing is intended to satisfy the filing obligation of the registrant as pre-commencement communications pursuant to Rule 14d-2(b) under the Exchange Act. Reference 1: http://www.xbrl.org/2003/role/presentationRef
-Publisher SEC
-Name Exchange Act
-Number 240
-Section 14d
-Subsection 2b
| Name: |
dei_PreCommencementTenderOffer |
| Namespace Prefix: |
dei_ |
| Data Type: |
xbrli:booleanItemType |
| Balance Type: |
na |
| Period Type: |
duration |
|
| X |
- DefinitionTitle of a 12(b) registered security. Reference 1: http://www.xbrl.org/2003/role/presentationRef
-Publisher SEC
-Name Exchange Act
-Number 240
-Section 12
-Subsection b
| Name: |
dei_Security12bTitle |
| Namespace Prefix: |
dei_ |
| Data Type: |
dei:securityTitleItemType |
| Balance Type: |
na |
| Period Type: |
duration |
|
| X |
- DefinitionName of the Exchange on which a security is registered. Reference 1: http://www.xbrl.org/2003/role/presentationRef
-Publisher SEC
-Name Exchange Act
-Number 240
-Section 12
-Subsection d1-1
| Name: |
dei_SecurityExchangeName |
| Namespace Prefix: |
dei_ |
| Data Type: |
dei:edgarExchangeCodeItemType |
| Balance Type: |
na |
| Period Type: |
duration |
|
| X |
- DefinitionBoolean flag that is true when the Form 8-K filing is intended to satisfy the filing obligation of the registrant as soliciting material pursuant to Rule 14a-12 under the Exchange Act. Reference 1: http://www.xbrl.org/2003/role/presentationRef
-Publisher SEC
-Name Exchange Act
-Number 240
-Section 14a
-Subsection 12
| Name: |
dei_SolicitingMaterial |
| Namespace Prefix: |
dei_ |
| Data Type: |
xbrli:booleanItemType |
| Balance Type: |
na |
| Period Type: |
duration |
|
| X |
- DefinitionTrading symbol of an instrument as listed on an exchange.
| Name: |
dei_TradingSymbol |
| Namespace Prefix: |
dei_ |
| Data Type: |
dei:tradingSymbolItemType |
| Balance Type: |
na |
| Period Type: |
duration |
|
| X |
- DefinitionBoolean flag that is true when the Form 8-K filing is intended to satisfy the filing obligation of the registrant as written communications pursuant to Rule 425 under the Securities Act. Reference 1: http://www.xbrl.org/2003/role/presentationRef
-Publisher SEC
-Name Securities Act
-Number 230
-Section 425
| Name: |
dei_WrittenCommunications |
| Namespace Prefix: |
dei_ |
| Data Type: |
xbrli:booleanItemType |
| Balance Type: |
na |
| Period Type: |
duration |
|
| X |
- Details
| Name: |
us-gaap_StatementClassOfStockAxis=MSBI_CommonStock0.01ParValueMember |
| Namespace Prefix: |
|
| Data Type: |
na |
| Balance Type: |
|
| Period Type: |
|
|
| X |
- Details
| Name: |
us-gaap_StatementClassOfStockAxis=MSBI_DepositarySharesEachRepresenting140thInterestInShareOf7.750FixedrateResetNoncumulativePerpetualPreferredStockSeries2.00ParValueMember |
| Namespace Prefix: |
|
| Data Type: |
na |
| Balance Type: |
|
| Period Type: |
|
|
Midland States Bancorp (NASDAQ:MSBI)
Gráfica de Acción Histórica
De Nov 2024 a Dic 2024

Midland States Bancorp (NASDAQ:MSBI)
Gráfica de Acción Histórica
De Dic 2023 a Dic 2024
